- Weak RSI levels might trigger the Aussie pair’s pullback from short-term important support-line.
- 50% of Fibonacci retracement offers additional support during the pair’s further declines.
Even if immediate descending trend-line and trading below 23.6% Fibonacci retracement portray the AUD/USD pair’s weakness, it still needs to slip beneath key support as it makes the rounds to 0.7040 during early Monday.
Gradually declining levels of 14-bar relative strength index (RSI) might trigger the pair’s U-turn from 8-day old trend-line support, at 0.7035, failing to which can drag the quote to 200-hour moving average (HMA) level of 0.7010.
In a case where prices fail to respect 0.7010 mark, 50% Fibonacci retracement of an up-move since July 10, at 0.6995, could be on the bears’ radar.
On the upside, 0.7050/55 comprising adjacent resistance-line can keep the buyers away whereas 0.7065 and 0.7085 could follow the breakout of near-term key resistances.
AUD/USD hourly chart
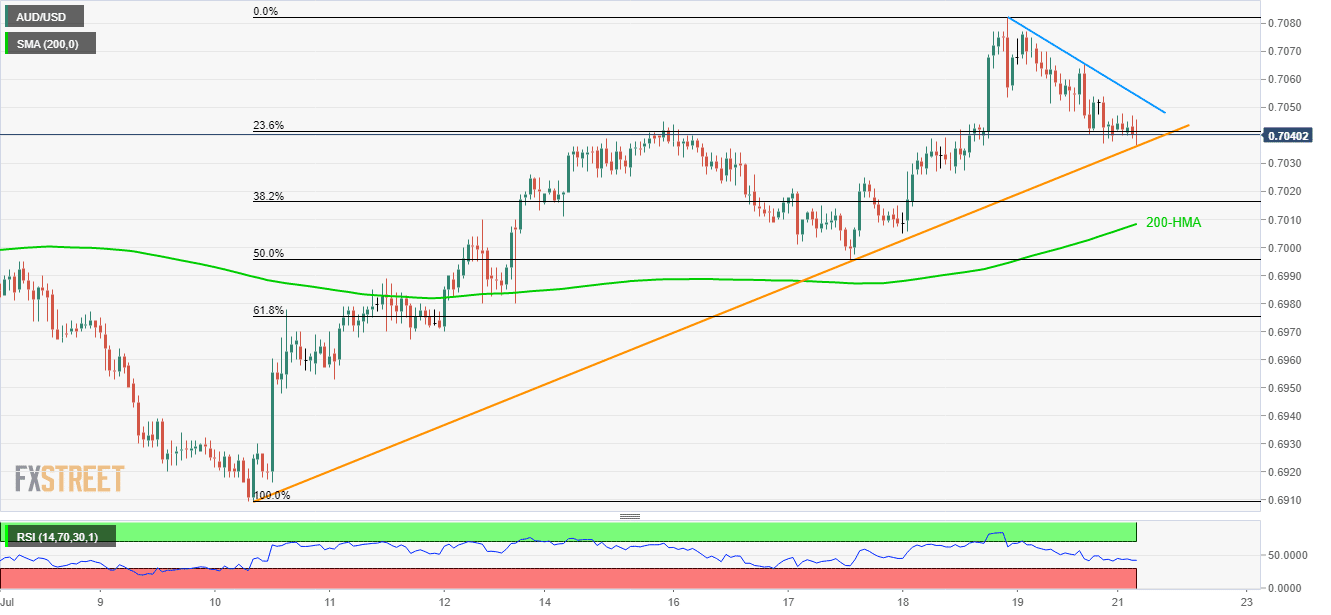
Trend: Bullish
