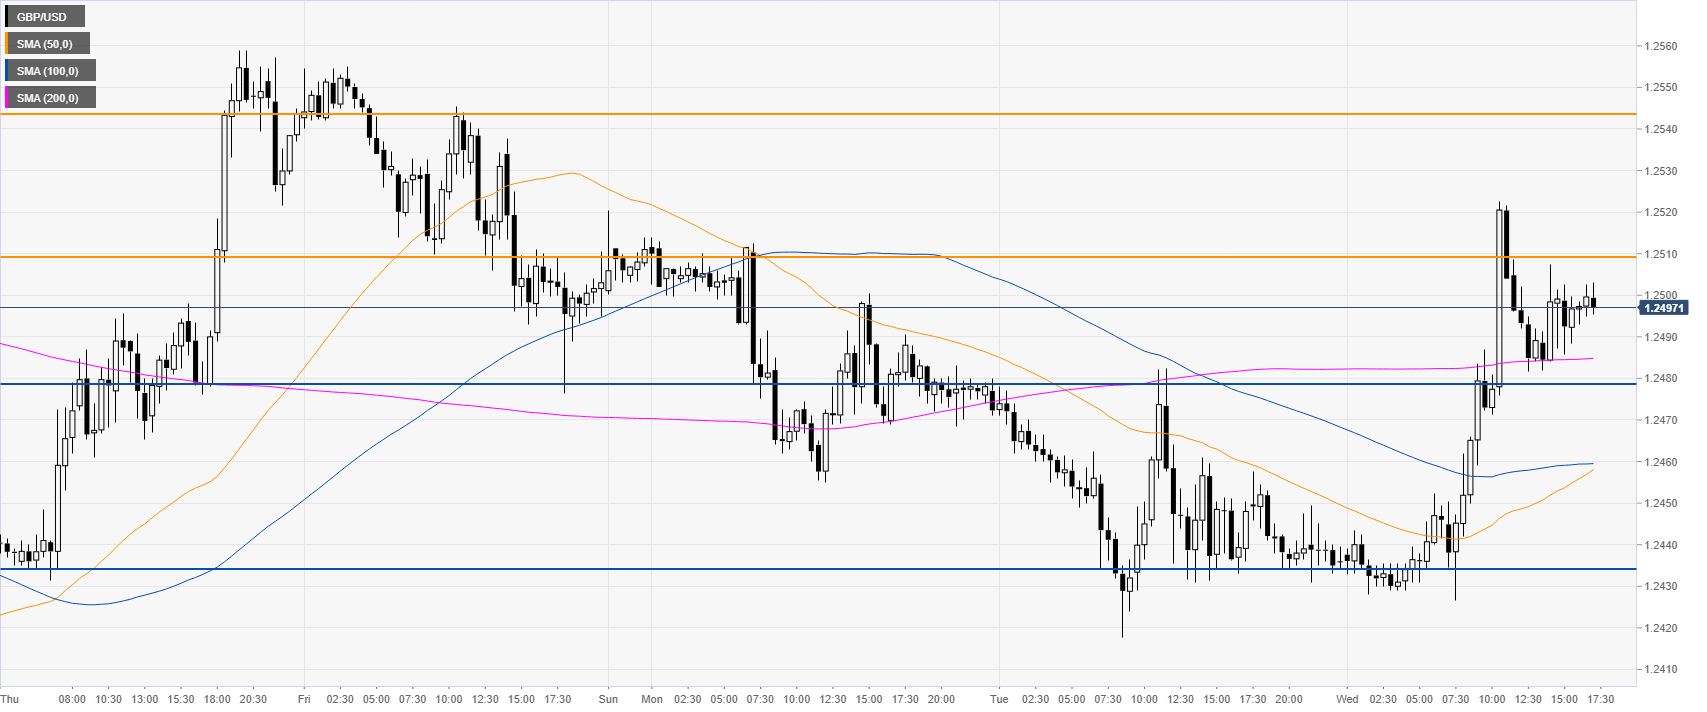
- GBP/USD found resistance at the 1.2510 level in the New York session.
- The levels to beat for sellers can be seen at 1.2478 and 1.2435, according to the Technical Confluences Indicator.
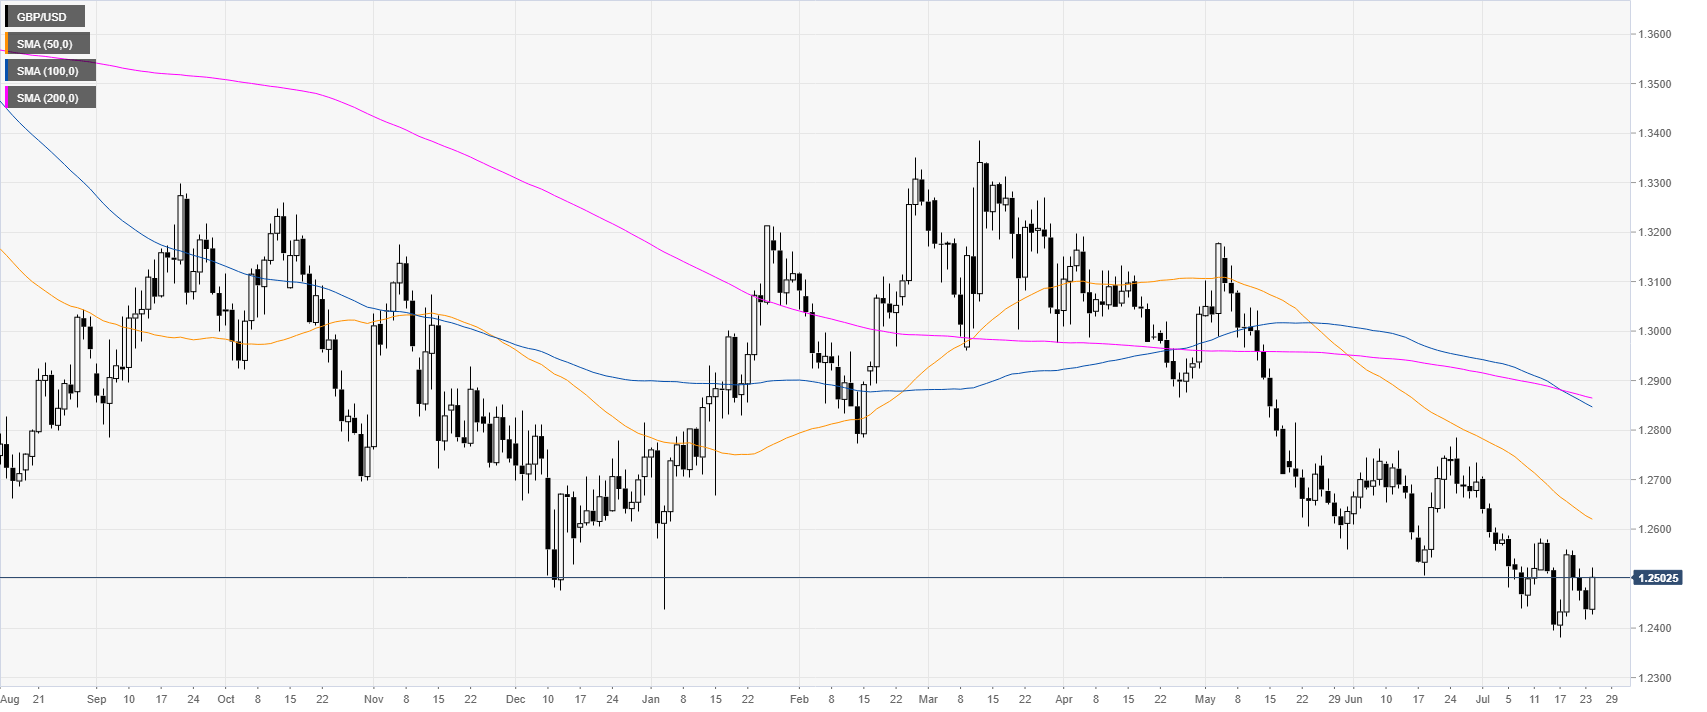
GBP/USD daily chart
Cable is trading in a bear trend below its main daily simple moving averages (DSMAs). The market is attempting to retake the 1.2500 figure as challenge the weekly high.
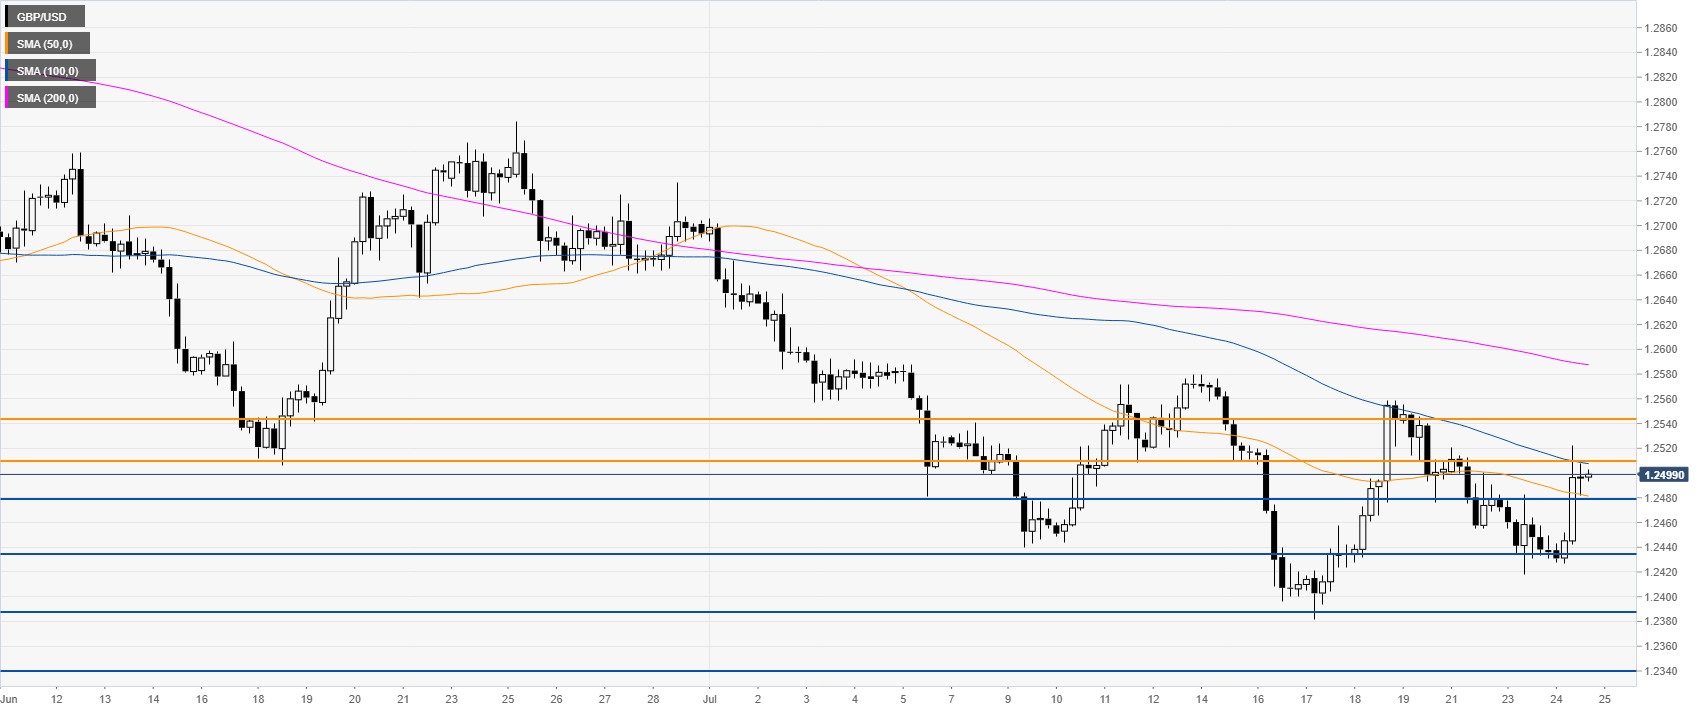
GBP/USD 4-hour chart
The market is trading below descending 100/200 SMAs suggesting a bearish bias in the medium term. Sellers need a break below 1.2478 support to reach 1.2435 on the way down, according to the Technical Confluences Indicator.
GBP/USD 30-minute chart
GBP/USD is trading between the 1.2510 resistance and the 200 SMA. The market found strong resistance near the 1.2510 level suggesting that the main bear trend remains in effect. Immediate resistances are seen at 1.2510 and 1.2544.
Additional key levels
