- Descending trend-channel, sustained trading below 200-HMA and downward sloping RSI portrays GBP/USD weakness.
- 1.2382 becomes the key support with 23.6% Fibonacci retracement being an immediate rest.
Although a 3-day long descending trend-channel portrays the GBP/USD pair’s weakness, soft RSI and 23.6% Fibonacci retracement limit further declines as the quote trades around 1.2435 during the early Asian session on Wednesday.
A downward sloping trend-line on 14-bar relative strength index (RSI) portrays lack of underlying momentum that may gain traction towards channel resistance, at 1.2465, and 200-hour moving average (HMA) level of 1.2490 if successfully breaking 38.2% Fibonacci retracement near 1.2458.
Meanwhile, 23.6% Fibonacci retracement level of mid-July downpour, at 1.2430, and channel’s support surrounding 1.2410 can entertain short-term sellers ahead of pleasing them by re-offering monthly low near 1.2380.
GBP/USD hourly chart
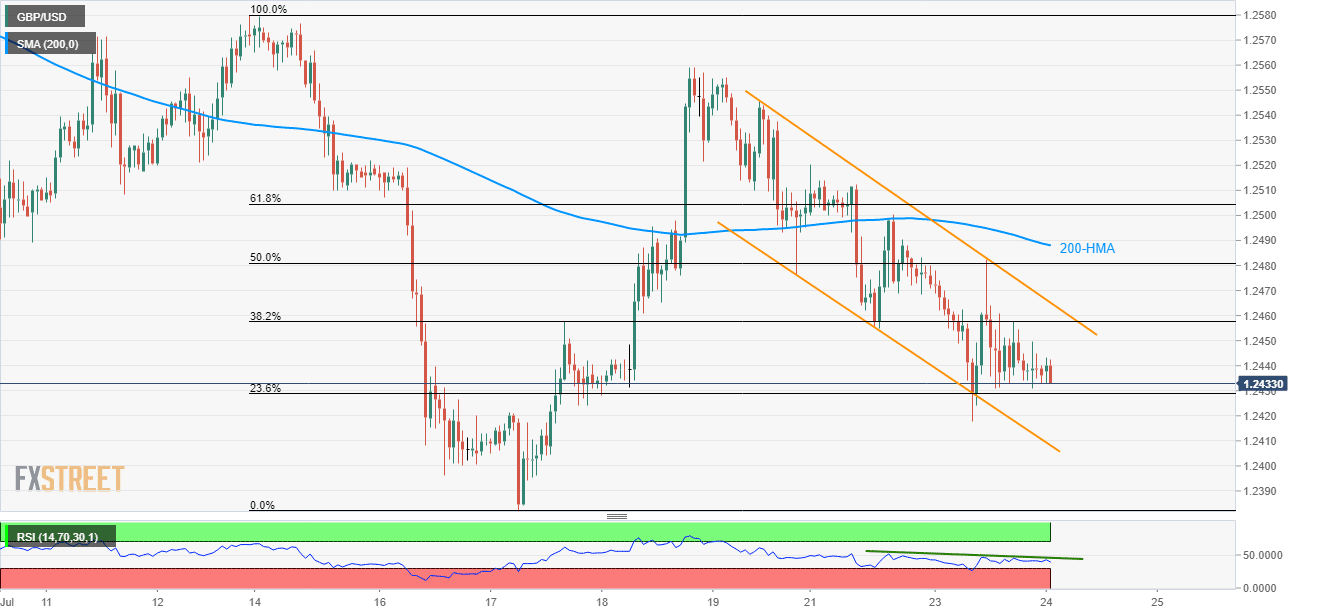
Trend: Bearish
