- Gold is consolidating at multi-month tops below the 1,430.00 resistance.
- The level to beat for bears is the 1,420.00 support followed by 1,414.00 and the 1,400.00.
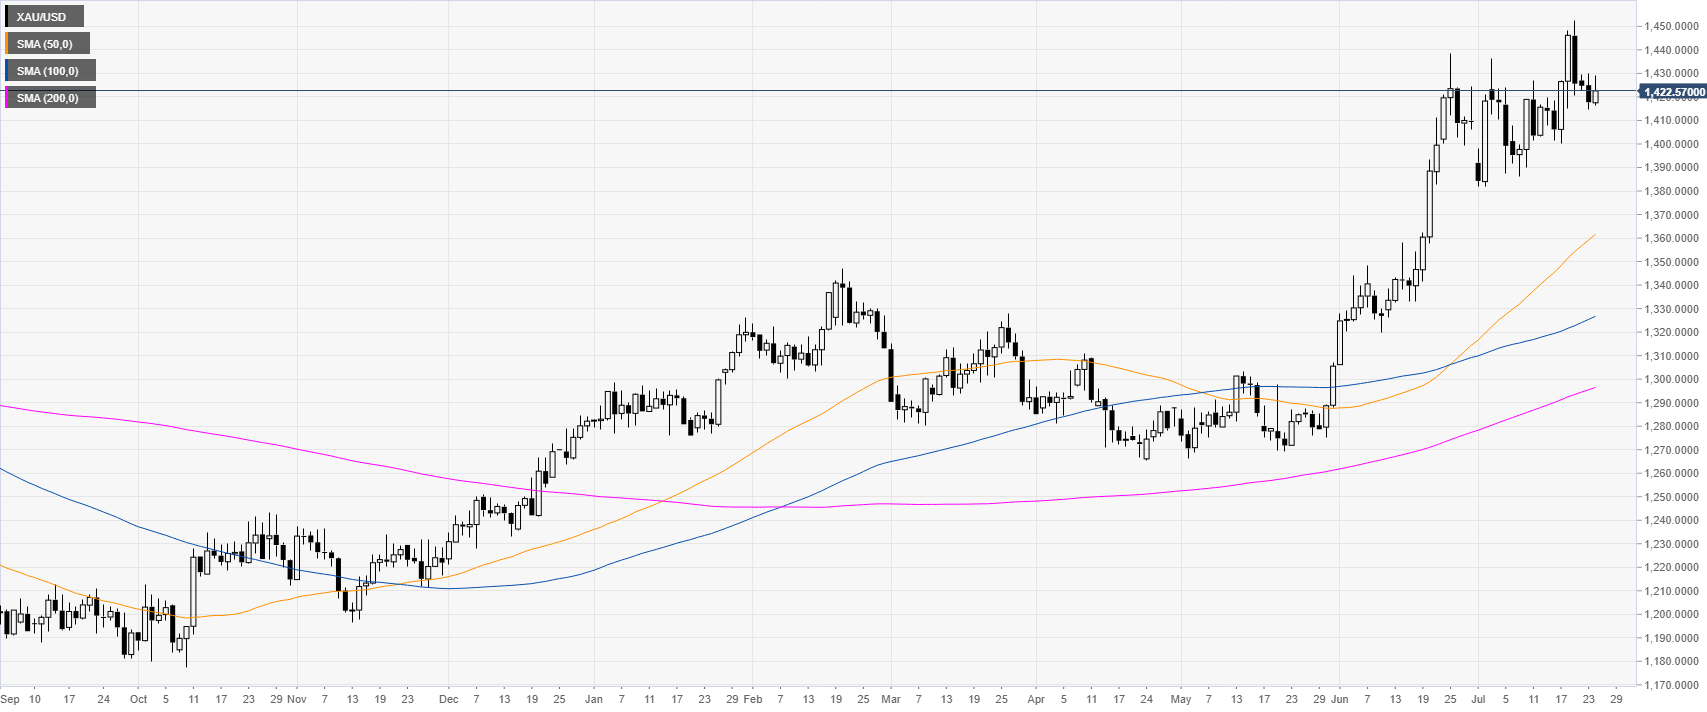
Gold daily chart
Gold is trading above its main daily simple moving averages (DSMAs) as the bulls hold on above the $1,400.00 per troy ounce.
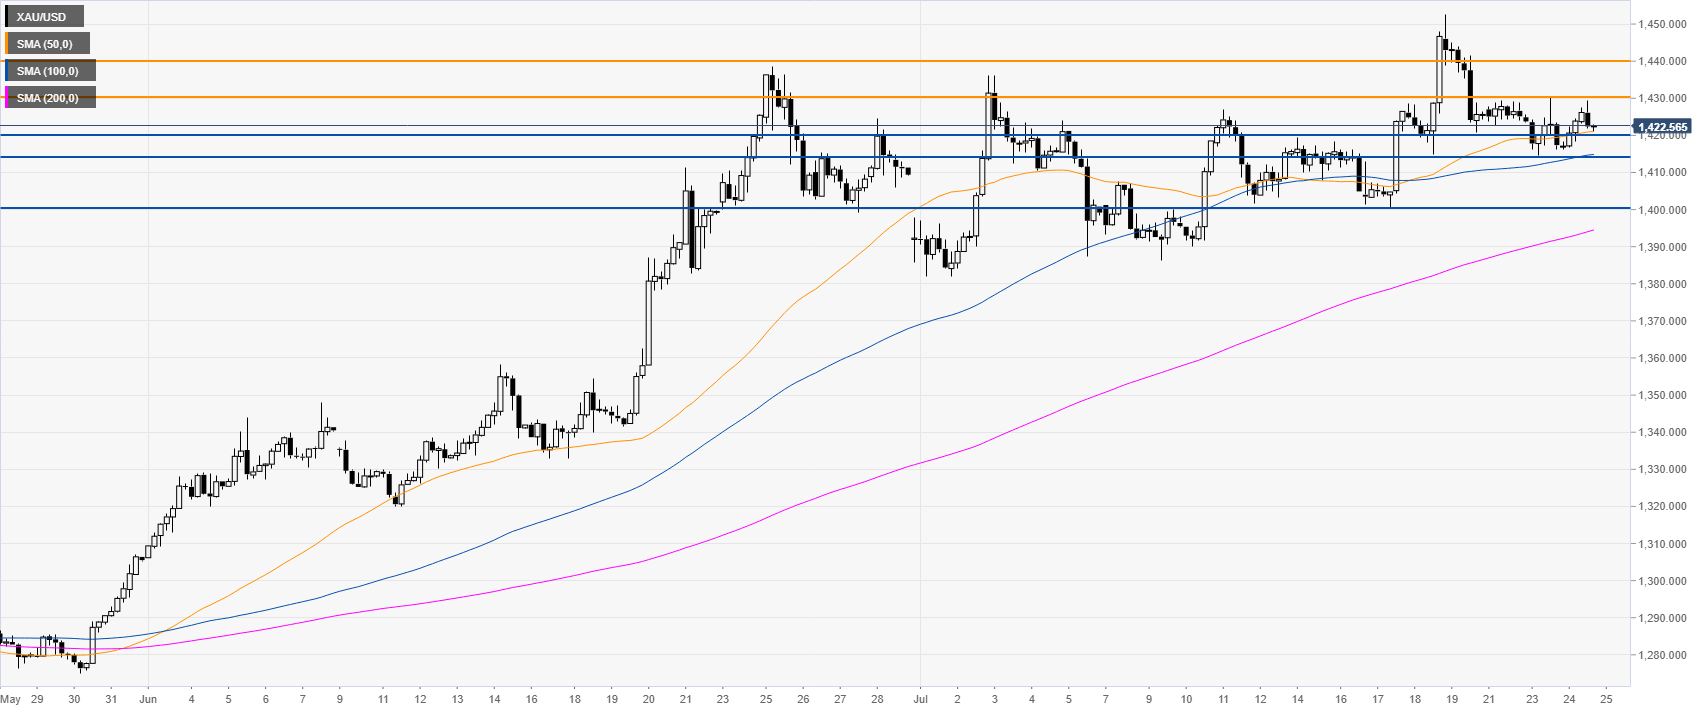
Gold 4-hour chart
The yellow metal is trading above its main DSMAs suggesting a bullish bias in the medium term. However, bulls need to overcome the 1,430.00 resistance to reach 1,440.00 on the way up.
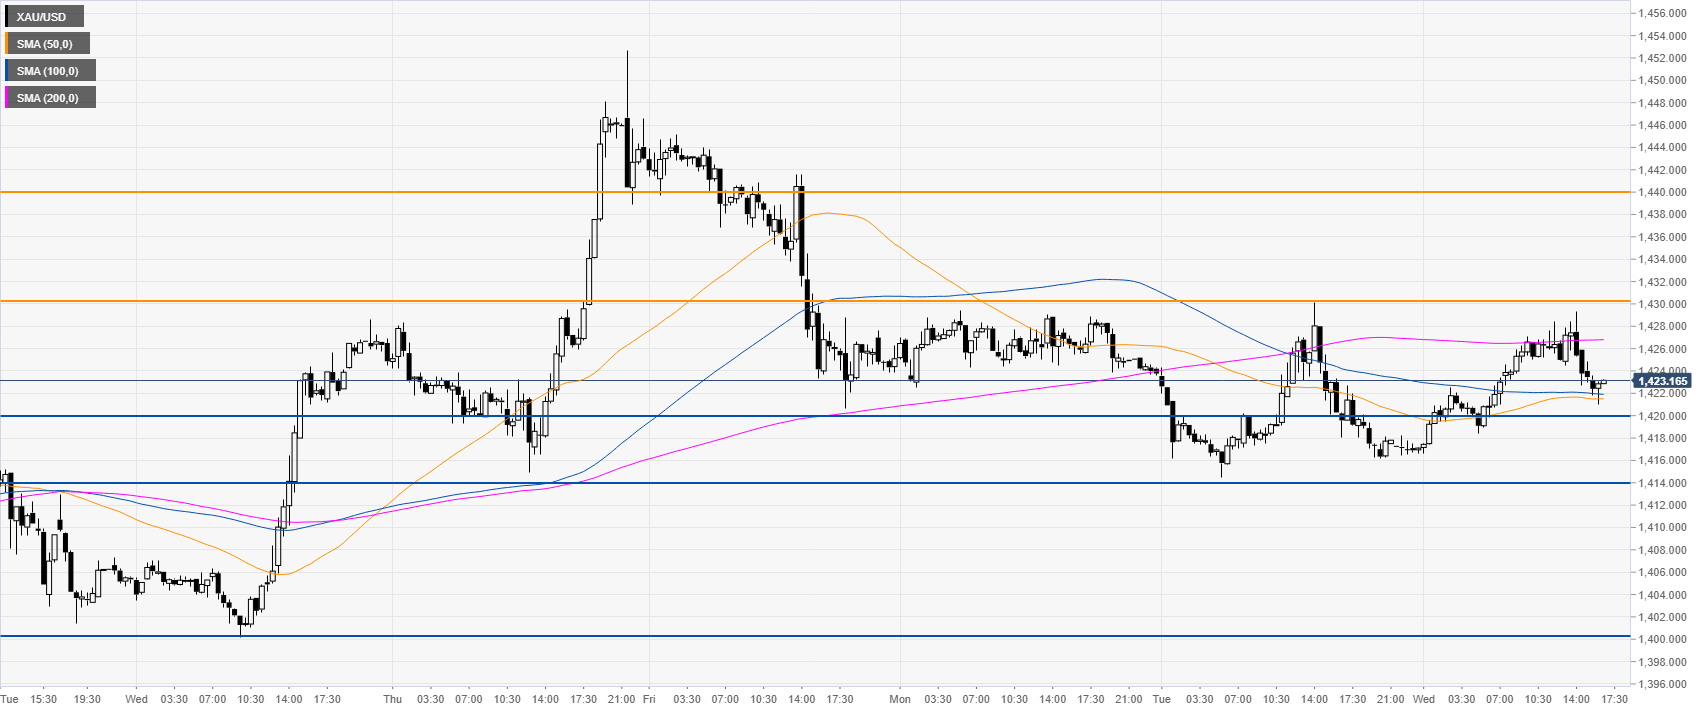
Gold 30-minute chart
Gold is trading below the 1,430.00 resistance and the 200 SMA, suggesting further consolidation down in the near term. A break below 1,420.00 can lead to 1,414.00 and the 1,400.00 handle.
Additional key levels
