- GBP/USD seesaws within an 8-day long symmetrical triangle.
- 100-hour EMA offers immediate support.
While more than a week old triangle formation limits the GBP/USD pair’s near-term moves, the quote recently bounced off the 100-hour exponential moving average (EMA) as it traders near 1.2480 heading into the UK open on Thursday.
Pair’s latest pullback enables it to question 61.8% Fibonacci retracement of mid-month declines, at 1.2504. However, a week old downward sloping trend-line at 1.2515 and the triangle resistance near 1.2536 could restrict further upside, if not then chances of the pair’s rally to early-month high surrounding 1.2580 can’t be denied.
On the downside break of 100-hour EMA, at 1.2475 now, prices can slump to formation support-line of 1.2435.
Should sellers keep dominating past-1.2435, July 17 low near 1.2380 could be on their radars to target.
GBP/USD hourly chart
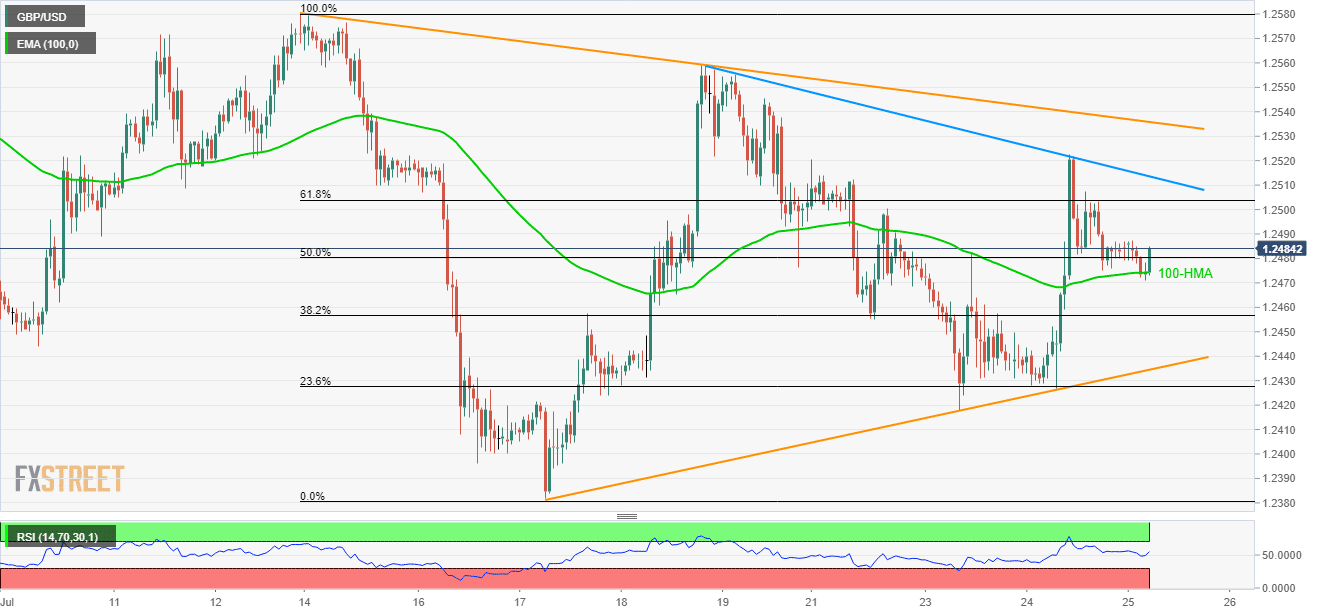
Trend: Sideways
