- GBP/USD has been below 4H 100MA since July 01.
- 4H 50MA, 23.6% Fibonacci retracement limits immediate downside.
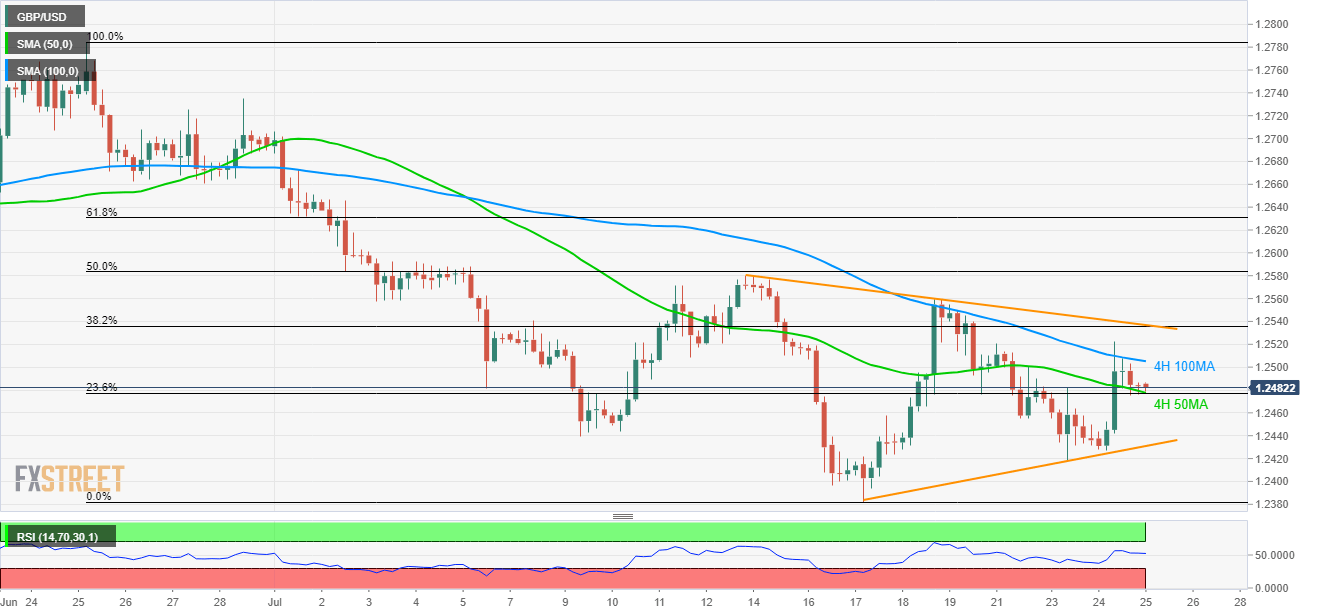
- Short-term symmetrical triangle adds technical levels to watch.
Not only near-term moving averages (MA) but an 8-day long symmetrical triangle also restricts the GBP/USD pair moves as it trades near 1.2480 during the early Asian session on Thursday.
A confluence of 50-bar moving average (4H 50MA) and 23.6% Fibonacci retracement of late-June to early-July downpour confine the quote’s nearby declines at 1.2477/78, a break of which highlights 1.2440/30 support-zone including July 09 low and support-line of the aforementioned triangle.
Alternatively, 4H 100MA at 1.2505, followed by the triangle resistance line at 1.2540, can keep the price advances under check.
If at all the quote recovers beyond 1.2540, it can aim for 1.2600 whereas a downside break of 1.2430 might not refrain from visiting 1.2382.
GBP/USD 4-hour chart
Trend: Sideways
