- 100/200 HMAs has recently been limiting Gold moves.
- Short-term ascending trend-line adds strength to the downside support.
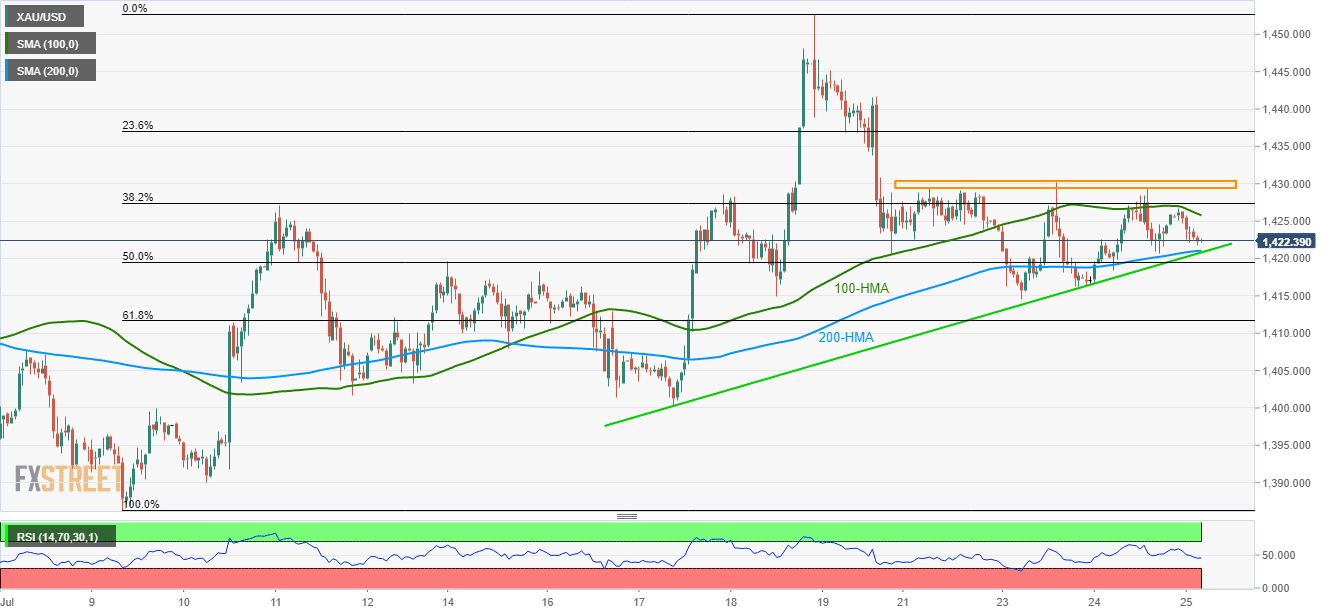
- $1,429.30/$1,430.20 area seems strong upside resistance beyond 100-HMA.
Following its failure to rise past-200 HMA and 38.2% Fibonacci retracement of current month upside, Gold declines to $1,422.30 heading into the European open on Thursday.
Currently, 200-hour moving average (HMA) and a week old upward sloping support-line, near $1,421 – $1,420.80, becomes the tough nut to crack for the sellers targeting the weekly low near $1,414.50.
However, quote’s further downside can have 61.8% Fibonacci retracement near $1,411.70 and July 17 bottom around $1,400 could question sellers afterward.
On the upside, 100-HMA level of $1,425.80 acts as an adjacent resistance whereas an area comprising $1,429.30 to $1,430.20 could limit additional rise.
It should be noted that the metal’s rally above $1,430.20 can aim for $1,434, $1,441 and monthly top surrounding $1,452.70.
Gold hourly chart
Trend: Pullback expected
