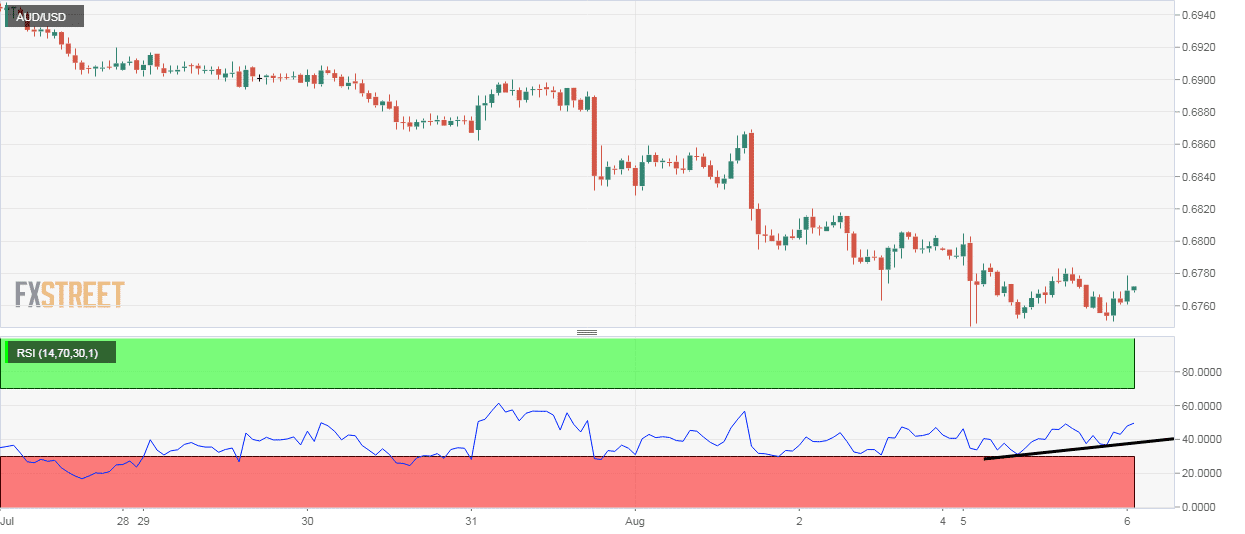
- AUD/USD has charted a bullish divergence of the RSI on the hourly chart.
- The pair could rise to 0.68 if the Aussie data beat estimates.
AUD/USD is currently trading at 0.6770, having hit a seven-month low of 0.6748.
With the bounce, the currency pair has confirmed a bullish divergence of the relative strength index (RSI) on the hourly chart.
A bullish RSI divergence occurs when the indicator charts higher lows, contradicting lower lows on the price chart. That pattern is widely considered an early warning of a bearish-to-bullish trend change.
So, a corrective rally to 0.68 cannot be ruled out, more so, as Yuan’s slide has triggered fears that the US will intervene in the FX markets to weaken the US Dollar.
Also, the bid tone around the AUD will likely strengthen if Australian trade numbers, due at 01:30 GMT, beat expectations.
Daily chart
Trend: Bullish
Pivot levels
