- The symmetrical triangle pattern limits GBP/USD moves.
- RSI, MACD both show a lack of momentum.
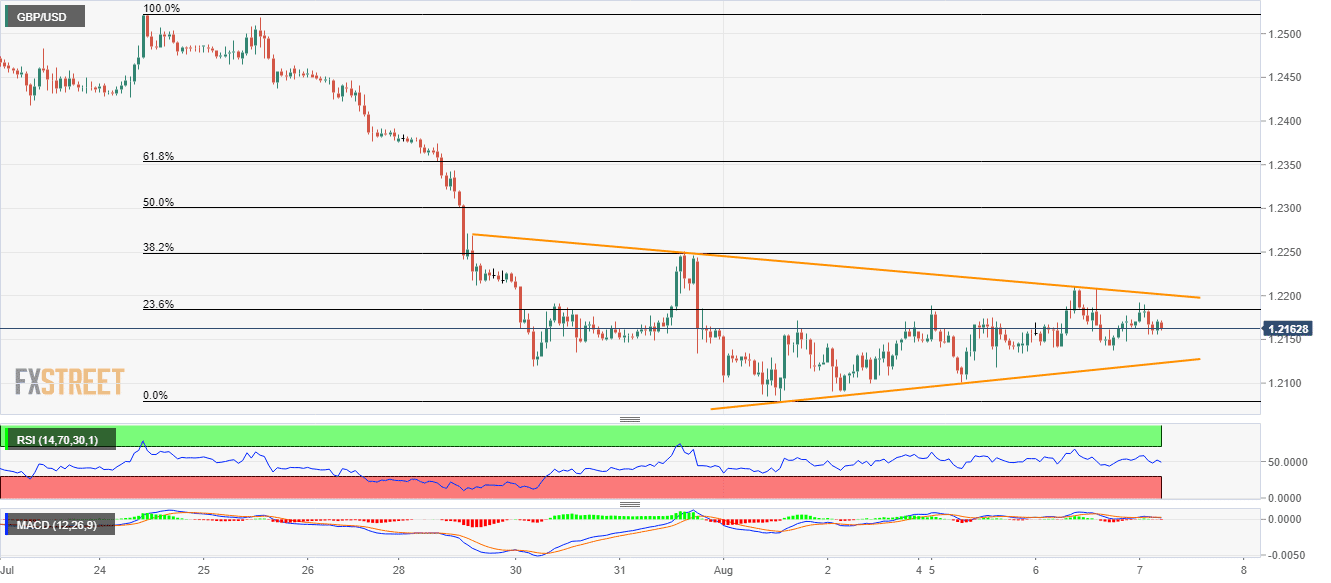
- Downside break highlights 2017 low, multiple resistances on the upside.
With a week old symmetrical triangle formation restricting the GBP/USD pair’s moves, the quote seesaws near 1.2165 ahead of Wednesday’s market open in the UK.
Also portraying the lack of momentum are 14-bar relative strength index (RSI) and moving average convergence and divergence (MACD) technical indicators.
The formation now portrays 1.2200 as the resistance, a break of which can trigger fresh upside towards 1.2250 and of targeting the 1.2270 level.
On the flipside, 1.2120 becomes the support to watch that holds the key to the pair’s downpour towards 1.2080 and then towards the year 2017 low near 1.1985.
GBP/USD hourly chart
Trend: Sideways
