- USD/IDR remains above key long-term DMA, increasing odds of further upside.
- 50% Fibonacci retracement and 50-DMA can question sellers during the downpour.
USD/IDR buyers are less likely to be disappointed from Tuesday’s downpour as far as the prices remain above the 200-day moving average (DMA). The quote clings to the key DMA level of 14,262 during the initial Asian trading on Wednesday.
In a case, sellers manage to sneak in, with a sustained break of 14,262, 50% Fibonacci retracement level of April-June declines, at 14,230, and 50-DMA level of 14,146 appear on their radar.
It should also be noted that bears’ dominance past-14,146 enables them to challenge 14,000 while keeping July month low near 13,884 as next target during further south-run.
Alternatively, 61.8% Fibonacci retracement near 14,344 should work as an immediate upside barrier whereas 14,420 and the recent high around 14,523 may lure buyers then after.
USD/IDR daily chart
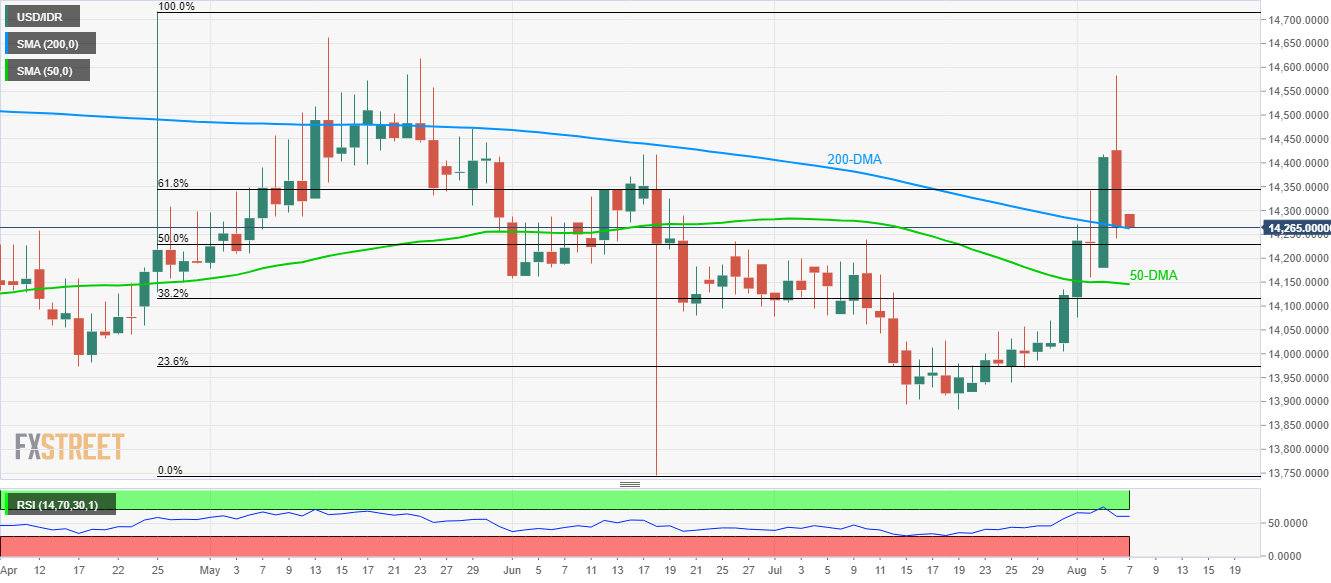
Trend: Bullish
