- The risk-off sentiment is currently on hold as Wall Street trimmed most of its daily losses.
- The level to beat for bulls are seen at 106.13-25 followed by the 106.48 resistance.
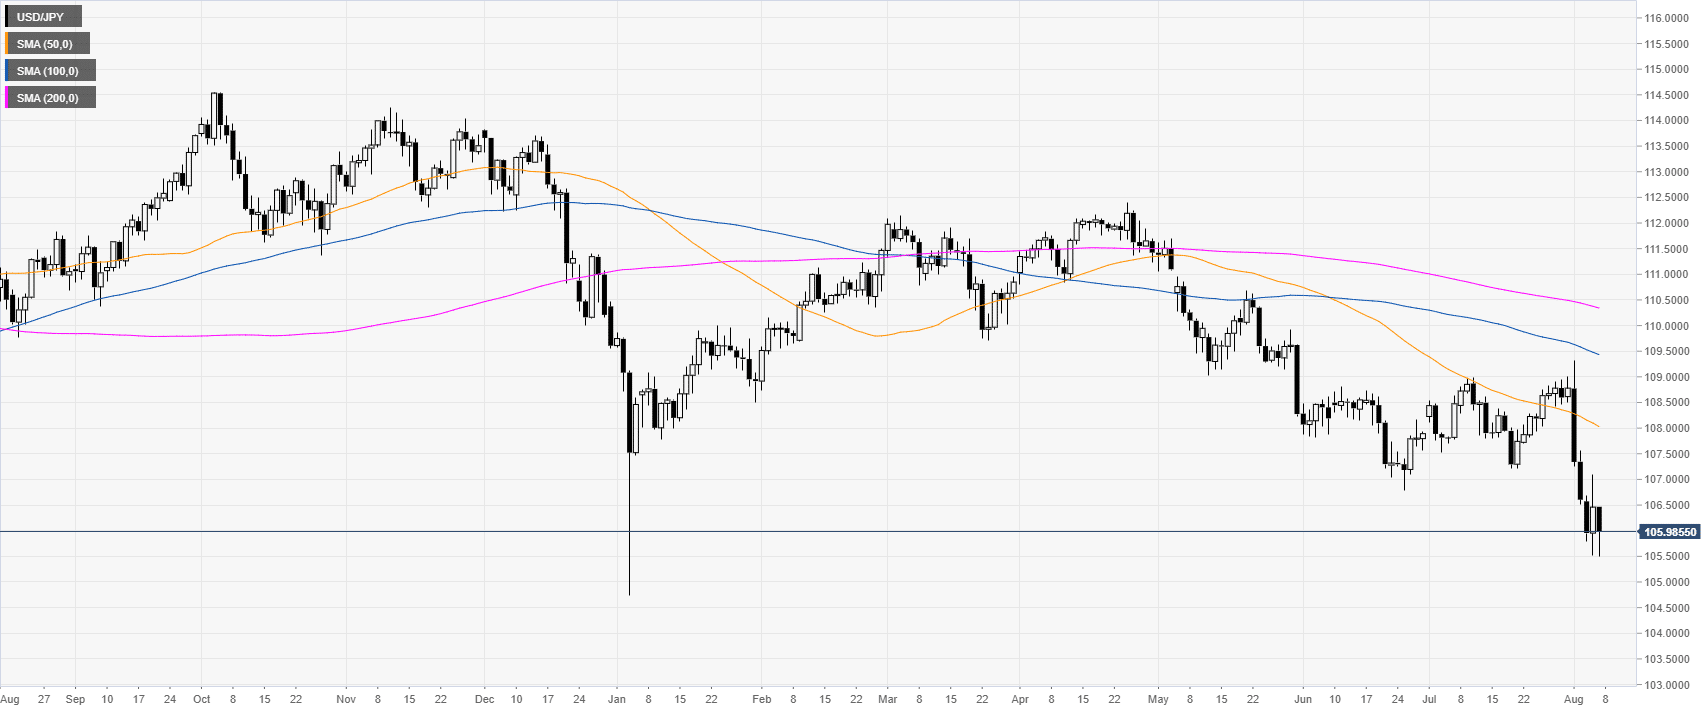
USD/JPY daily chart
USD/JPY is trading off multi-month lows while below its main daily simple moving averages (DSMAs). USD/JPY is currently taking its cues from trade war news.
USD/JPY 4-hour chart
USD/JPY is consolidating the drop in the first days of August while trading below its main SMAs. Bears would need to retake the 105.85, 105.65 and 105.30 support to resume the downtrend, according to the Technical Confluences Indicator.

USD/JPY 30-minute chart
The market is in consolidation mode. Bulls would need to break above the 106.13-25 resistance to trade towards 106.48, 106.91 and 107.20, according to the Technical Confluences Indicator.

Additional key levels
