- GBP/USD remains inside a three-day-long descending triangle below 200-HMA.
- Technical indicators show a lack of momentum.
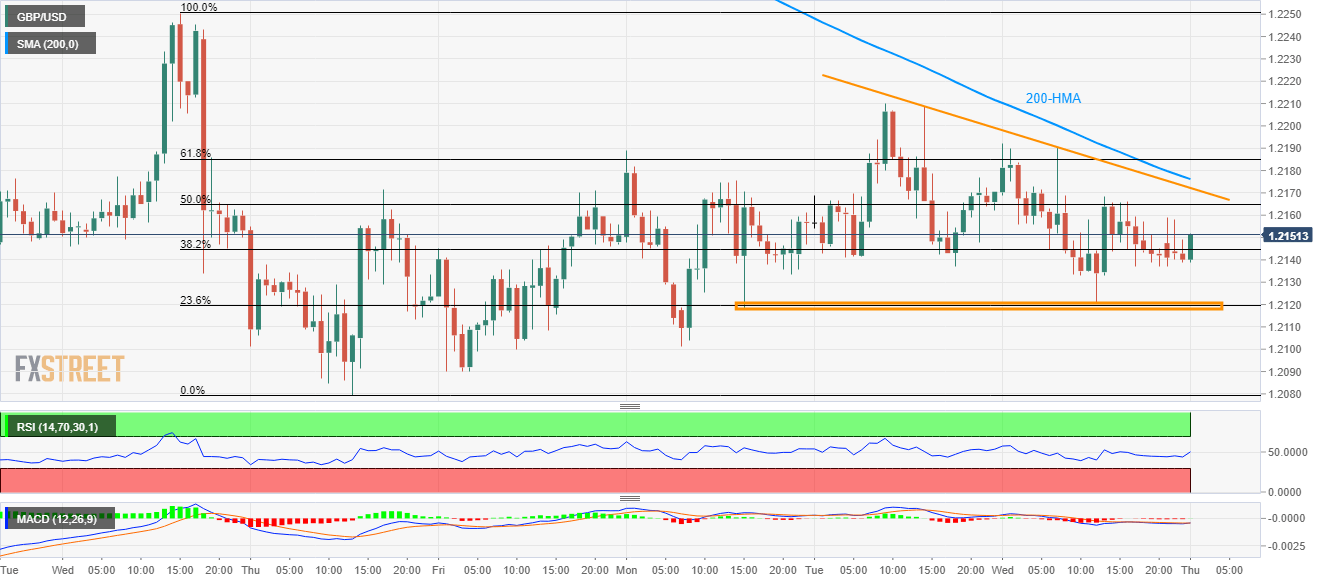
Despite frequently bouncing off 23.6% Fibonacci retracement of last week’s declines, GBP/USD refrains from breaking above short-term descending triangle, needless to mention about its trading below the 200-hour moving average (HMA). The quote currently takes the rounds to 1.2150 amid initial Thursday morning in Asian.
Pair’s upside break beyond triangle resistance of 1.2172 needs validation from 200-HMA level of 1.2177 to aim for current week’s high near 1.2210.
Should prices manage to remain strong above 1.2210, July-end top surrounding 1.2250 can lure buyers.
Meanwhile, 23.6% Fibonacci retracement at 1.2212 offers strong downside support to the pair ahead of dragging it to 1.2090 and present month’s low close to 1.2080.
It’s worth mentioning that 14-bar relative strength index (RSI) and moving average convergence and divergence (MACD) are both showing a lack of momentum.
GBP/USD hourly chart
Trend: Sideways
