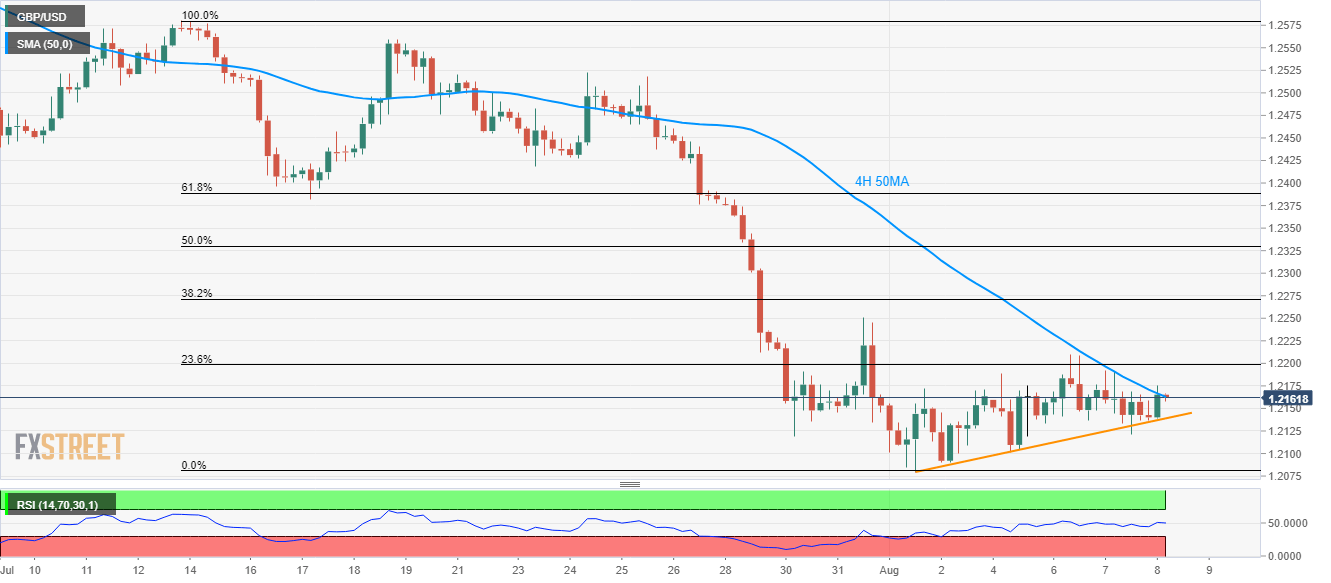
- Despite forming higher lows since the month-start, GBP/USD fails to cross 4H 50MA.
- 1.2250 offers additional upside barrier ahead of 61.8% Fibonacci retracement.
GBP/USD remains within the 50-bar moving average (4H 50MA) and five-day-old rising trend-line as it takes the rounds to 1.2163 ahead of the UK open on Thursday.
While a successful break of 1.2165 immediate resistance can propel the quote towards July-end high of 1.2250, pair’s further upside will be challenged by 61.8% Fibonacci retracement of July-14 to August-start declines, near 1.2390.
On the downside break of 1.2139 support-line figure, sellers can again aim for 1.2080 and then the 1.2000 psychological magnet.
GBP/USD hourly chart
Trend: Sideways
