- Sustained trading above 4H 50MA portrays USD/IDR strength.
- 38.2% Fibonacci retracement can offer immediate resistance ahead of 14,342.
- 61.8% Fibonacci retracement level, 14,090/88 and 4H 200MA act as strong supports.
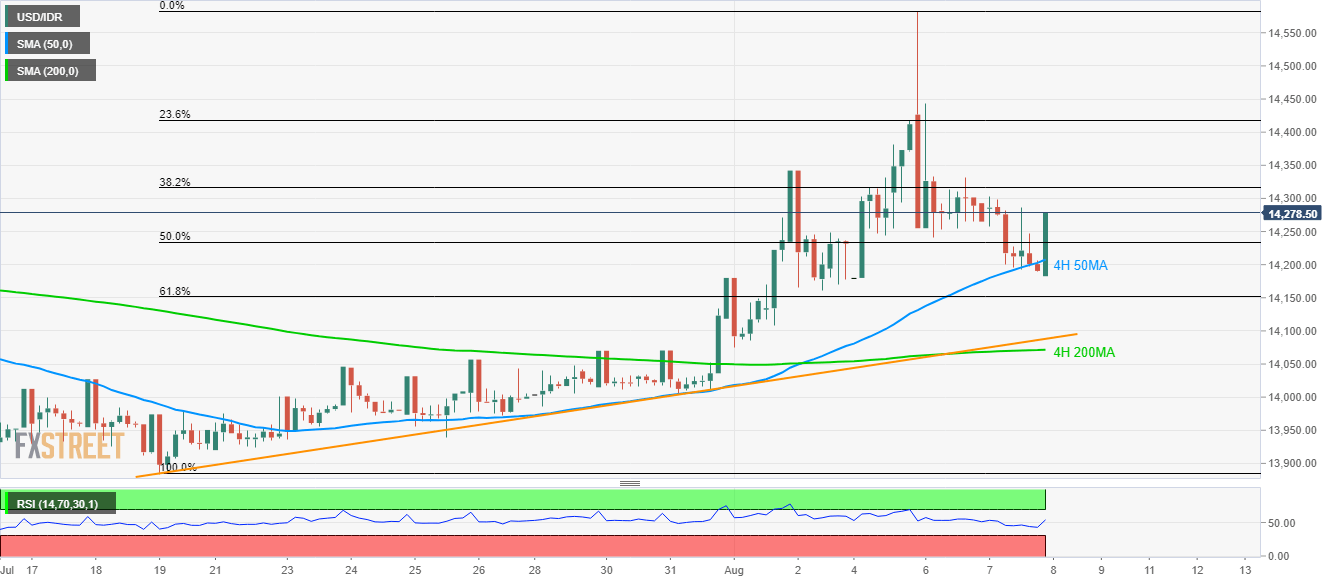
Having repeatedly bounced off 50-bar moving average on the 4-hour chart (4H 50MA), USD/IDR takes the bids to 14,279 during the initial Asian session on Thursday.
38.2% Fibonacci retracement of July – August upside near 14,317 acts as immediate resistance, a break of which can escalate the recovery towards 14,342 and then to 23.6% Fibonacci retracement level of 14,418.
Alternatively, sellers can target 61.8% Fibonacci retracement level of 14,152 only if prices remain negative below the latest low surrounding 14,180.
However, three-week-long ascending trend-line and 200-bar moving average (4H 200MA) can limit the pair’s further declines around 14,090/88 and 14,072/70 respectively.
USD/IDR 4-hour chart
Trend: Bullish
