- GBP/USD remains modestly unchanged below 200-hour EMA, 23.6% Fibonacci retracement of late-July to early-August decline.
- While upside break can recall 1.2250, 1.2080 becomes strong downside support.
GBP/USD continues its small range as it trades near 1.2142 heading into the UK market open on Friday.
While 200-hour exponential moving average (EMA) and 23..6% Fibonacci retracement limit the pair’s near-term upside around 1.2185/90, pair’s break of monthly low surrounding 1.2080 can trigger fresh downpour.
On the upside break, 38.2% Fibonacci retracement level of 1.2250 can please buyers whereas 1.2000 can lure bears if the quote ticks beneath 1.2080.
It should additionally be noted that technical indicators like 14-bar relative strength index (RSI) as well as moving average convergence and divergence are both showing a lack of momentum.
GBP/USD hourly chart
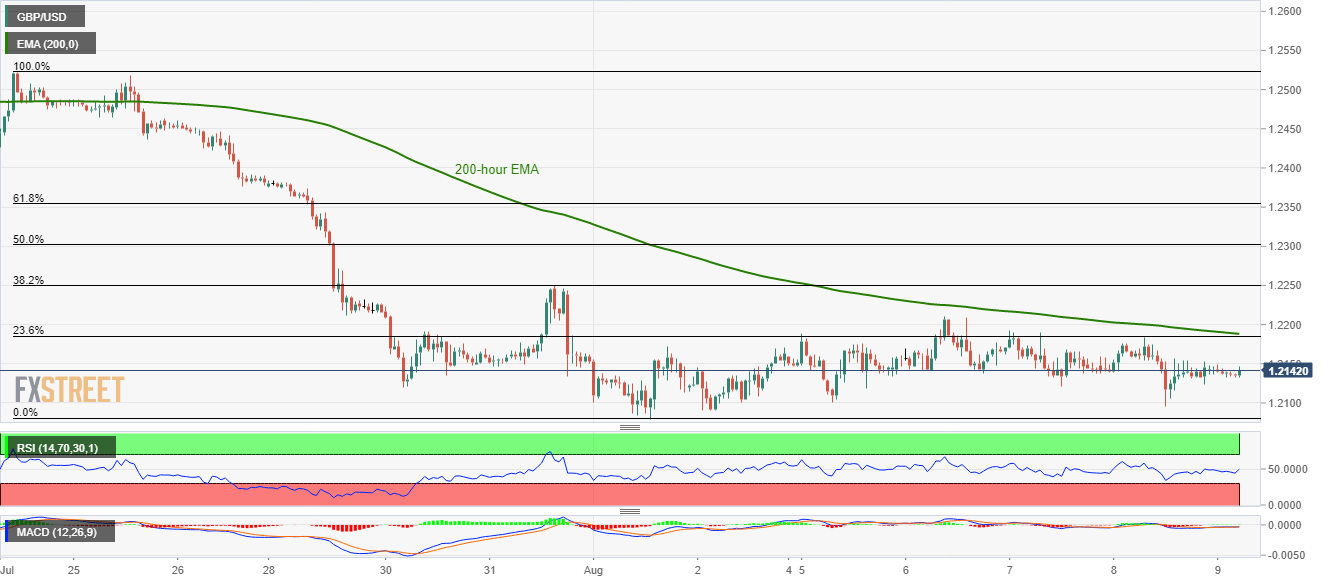
Trend: Sideways
