- USD/IDR nears the key support confluence comprising 21/50-day EMA and 23.6% Fibonacci retracement.
- 14,080/75 and 14,000 can please bears after the breakdown while 14,300 seem nearby resistance to watch for buyers.
Following the ower high formation on the daily chart from Tuesday, USD/IDR takes the rounds to 14,208 during the early Asian session on Friday.
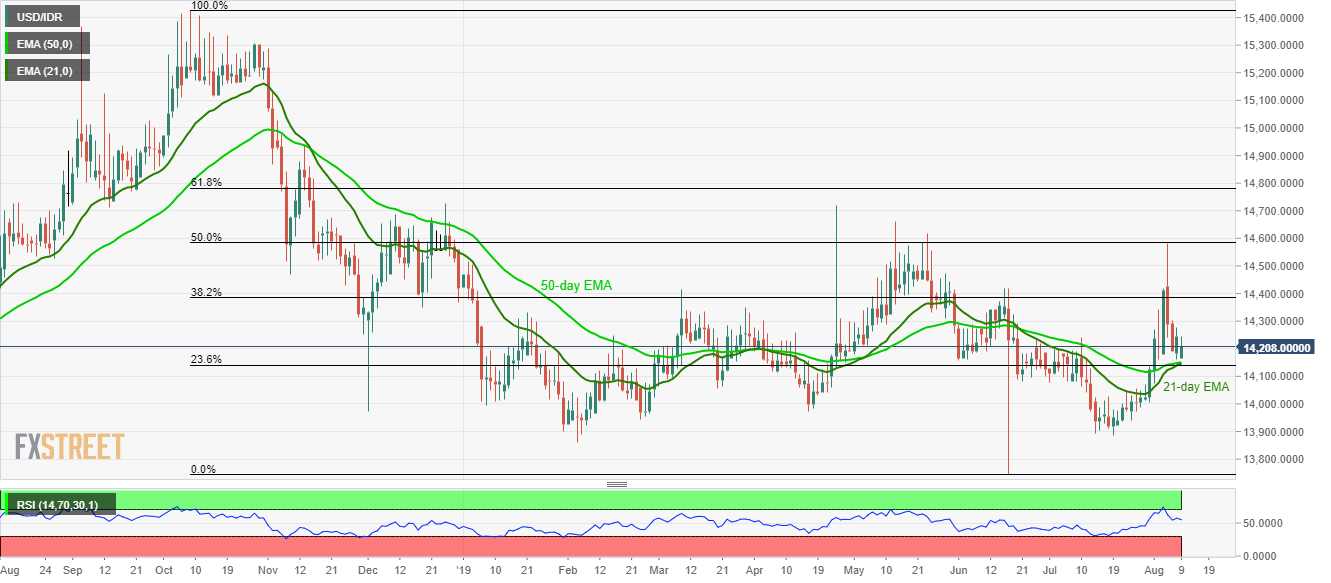
The pair is now near to 14,148/40 support confluence comprising 21and 50-day exponential moving averages (EMA), coupled with 23.6% Fibonacci retracement of pair’s October 2018 to June month downpour.
Should prices slip beneath 14,140, multiple lows marked during late-June, early July, surrounding 14,080/75 can please sellers ahead of pushing them to 14,000 round-figure.
On the upside, 14,300 and 38.2% Fibonacci retracement level of 14,392 are likely nearby resistances to watch during the quote’s further rise before watching over the monthly tops near 50% Fibonacci retracement level of 14,583.
USD/IDR daily chart
Trend: Pullback expected
