- Failure to rise past-61.8% Fibonacci retracement dragged AUD/USD.
- 100-HMA, 38.2% Fibonacci retracement limit immediate downside.
- 0.6753/46 offers additional downside support.
Although failure to break 61.8% Fibonacci retracement of late-July to early-August downpour portrays the AUD/USD pair’s weakness, sellers are being questioned by near-term key supports as the quote seesaws near 0.6780 on early Monday.
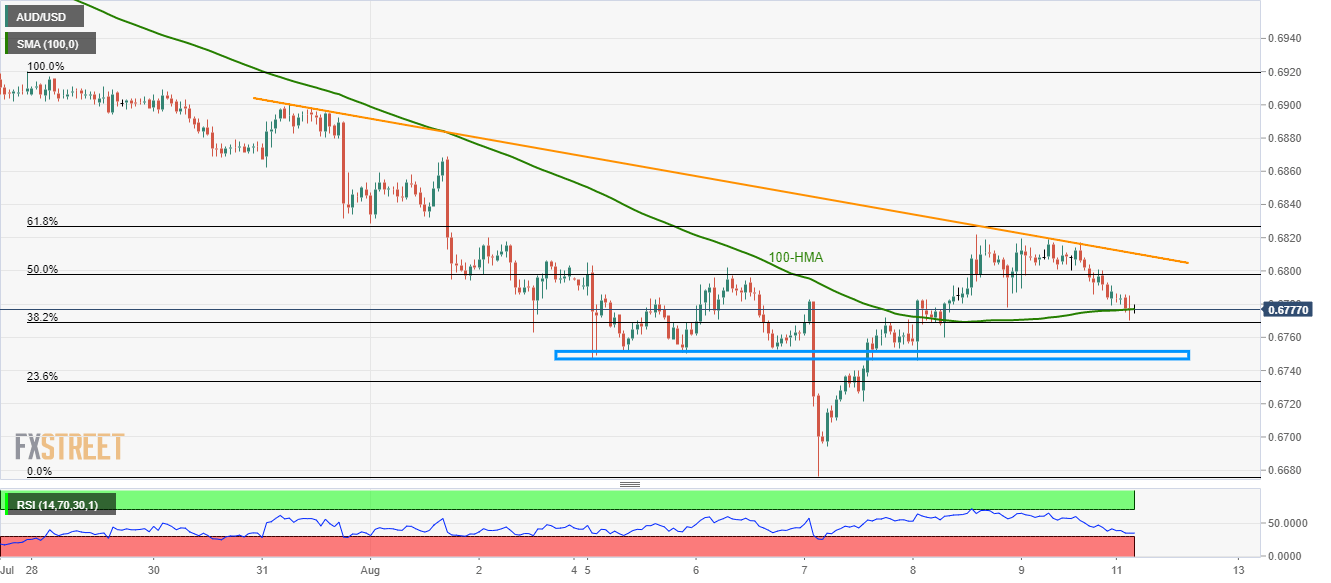
Among the immediate supports, 100-hour moving average (HMA) and 38.2% Fibonacci retracement level, near 0.6777/69, seems the key to watch as a break of which can drag prices to 0.6753/46 support-zone including multiple lows marked since early last-week.
Supporting the price restriction is oversold levels of 14-bar relative strength index (RSI), which in turn can trigger the quote’s U-turn towards 50% Fibonacci retracement level of 0.6800 ahead of highlighting a downward-sloping trend-line since July 31 at 0.6810.
During the pair’s further upside past-0.6810, 61.8% Fibonacci retracement level of 0.6827 and current month high near 0.6870 may lure buyers.
AUD/USD hourly chart
Trend: Pullback expected
