- USD/CAD forms the trend-reversal pattern on the hourly chart.
- A sustained break of 1.3250 can confirm the bullish set-up.
Despite taking rounds to 1.3220 during early Monday, the USD/CAD pair forms a bullish technical pattern on the hourly chart.
The falling wedge formation gets confirmed if the quote successfully rises past-1.3250 resistance, which in turn can trigger its fresh leg-up towards 1.3400 theoretical target.
However, current month high surrounding 1.3345 can offer intermediate halt during the rally.
Alternatively, pair’s declines below the formation support-line of 1.3185 can induce bears to aim for July 31 low around 1.3100.
USD/CAD hourly chart
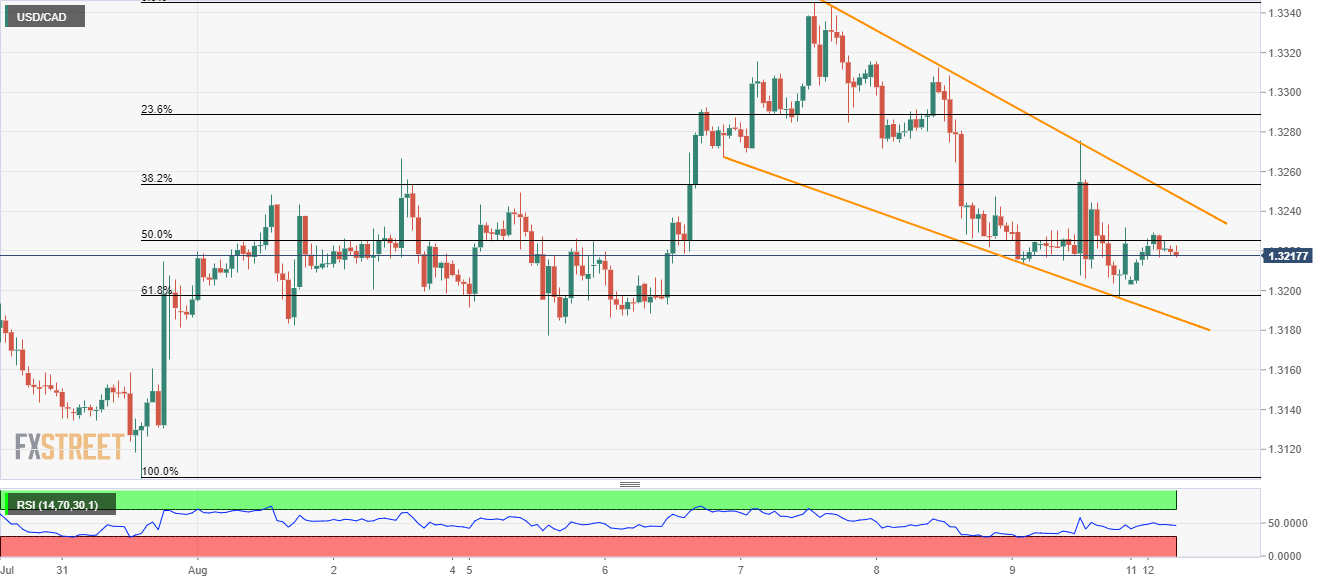
Trend: Bullish
