- USD/IDR follows a 4-day old declining trend-channel formation.
- 61.8% Fibonacci retracement, 14,120/17 confluence and 4H 200MA become the key supports to watch.
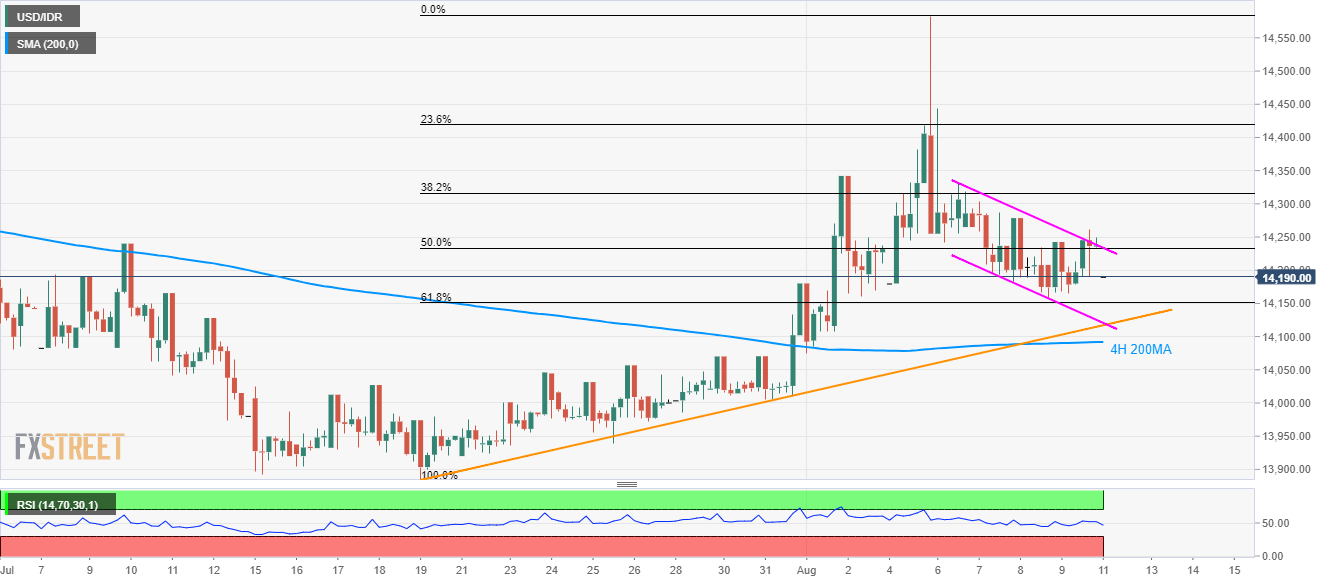
USD/IDR remains inside a short-term declining channel while taking rounds to 14,190 during the early Asian session on Monday.
While the bearish formation portrays the pair’s weakness, 61.8% Fibonacci retracement of late-July to early-August rise, at 14,150 becomes the immediate support to watch, a break of which highlights the importance of 14,120/17 confluence including channel’s support and a rising trend-line since July 19.
Additionally, 200-bar moving average on the 4-hour chart (4H 200MA) at 14,091 also becomes the key support to watch.
Alternatively, pair’s successful rise above channel’s resistance-line of 14,234 can propel the quote to 14,333 and then towards 23.6% Fibonacci retracement level near 14,420.
USD/IDR 4-hour chart
Trend: Pullback expected
