- Risk-on is strengthening the Greenback and weakening safe-haven assets.
- EUR/USD is ending Tuesday below the 1.1173 level.
- USTR additional tariffs on some products will be delayed to December 15.
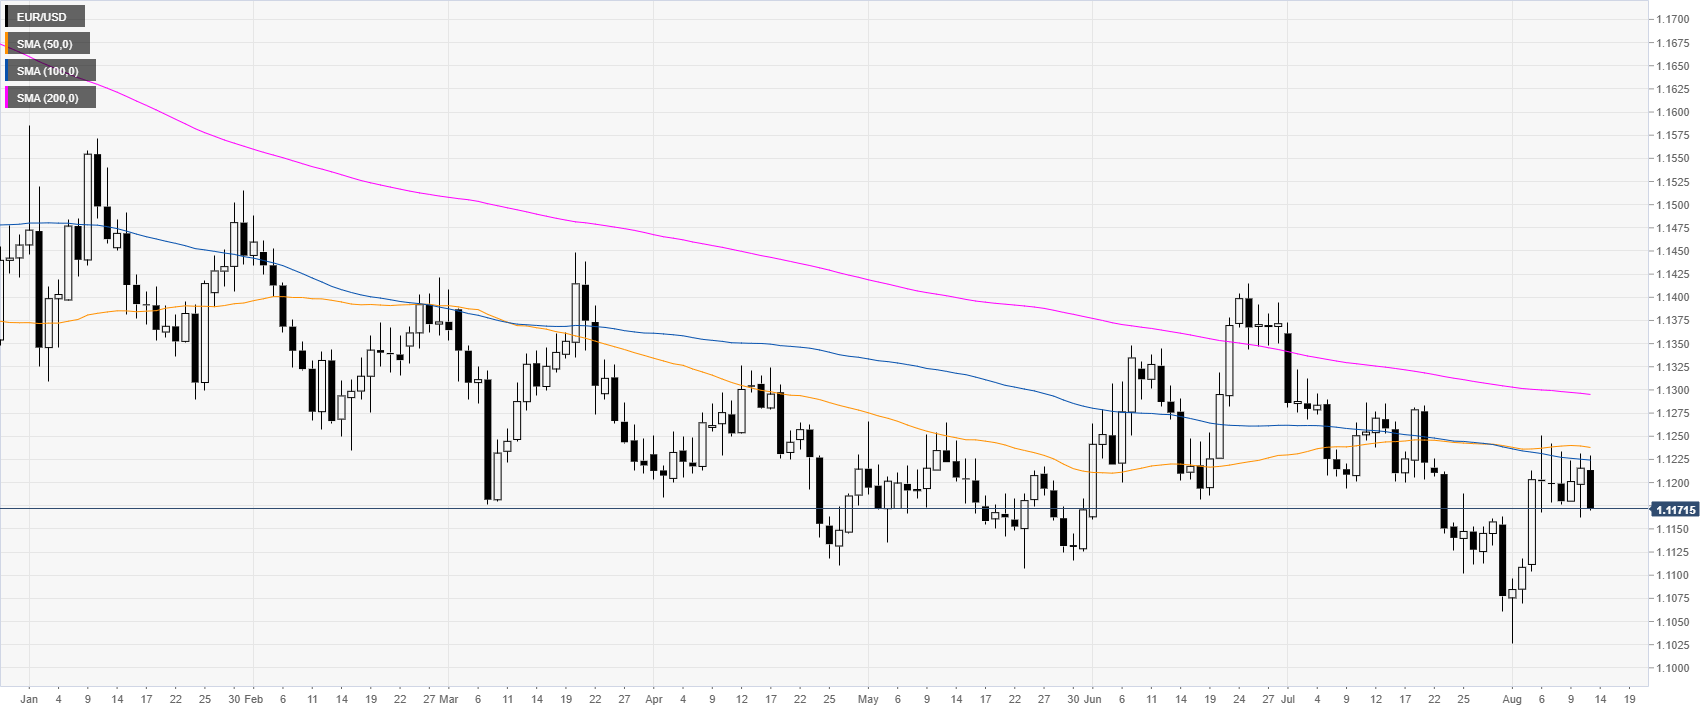
EUR/USD daily chart
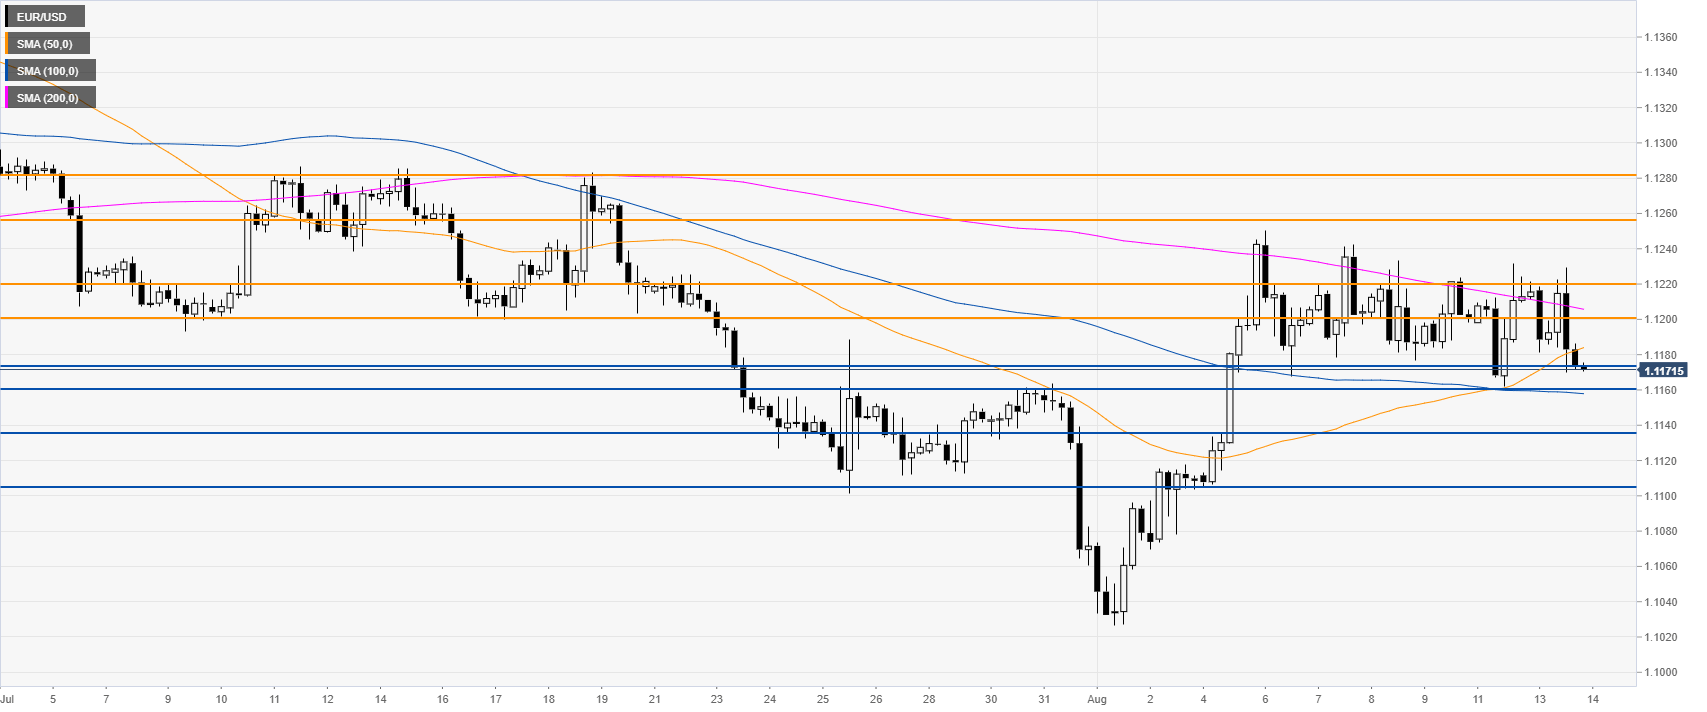
EUR/USD has been trapped in a range for six consecutive days. The common currency is capped by the 1.1220/55 resistances as well as the 50/100-day simple moving averages (DSMAs). The US said some tariffs would be delayed until December 15. The news sparked a risk-on environment as US stock indices and WTI leapt higher, safe-haven Gold, Yen and CHF sold-off and the Greenback rose.
EUR/USD 4-hour chart
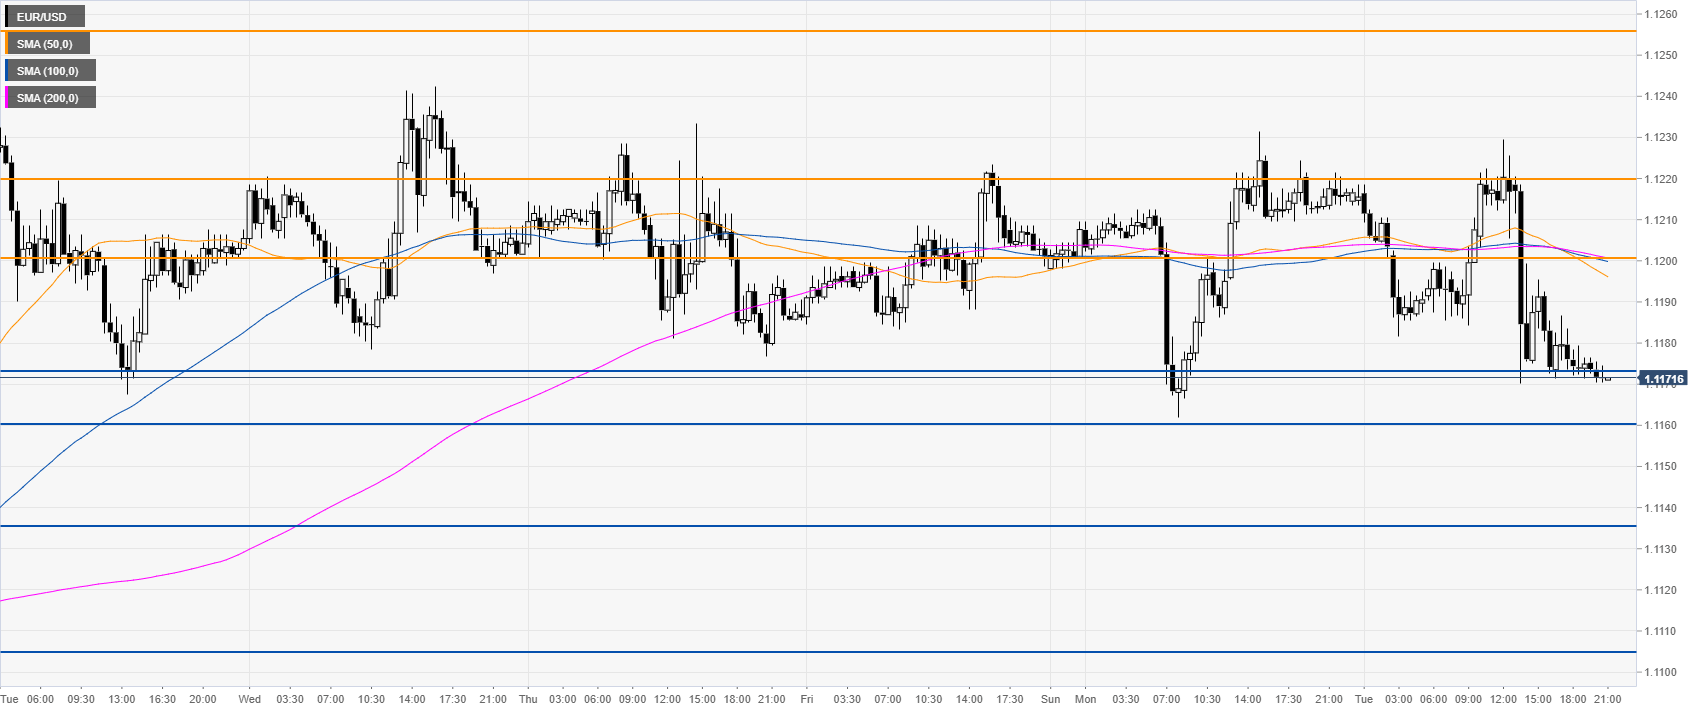
EUR/USD is in a range between the 1.1255 resistance and the 1.1160 support while the market is trading below a downward sloping 200 SMA. Bears are challenging the 1.1173 support. However, ideally EUR/USD would need a daily close below 1.1160 to confirm a bearish bias in the medium term.
EUR/USD 30-minute chart
The market is about to end Tuesday near 1.1173 while below its main SMAs. Today’s decline might lead to further losses. Immediate resistances are seen at 1.1200 and 1.1220, according to the Technical Confluences Indicator.
Additional key levels
