- DXY (US Dollar Index) rises to daily highs as the market break 97.85 resistance.
- The next targets to the upside can be located at 98.10 and the 98.38 levels.
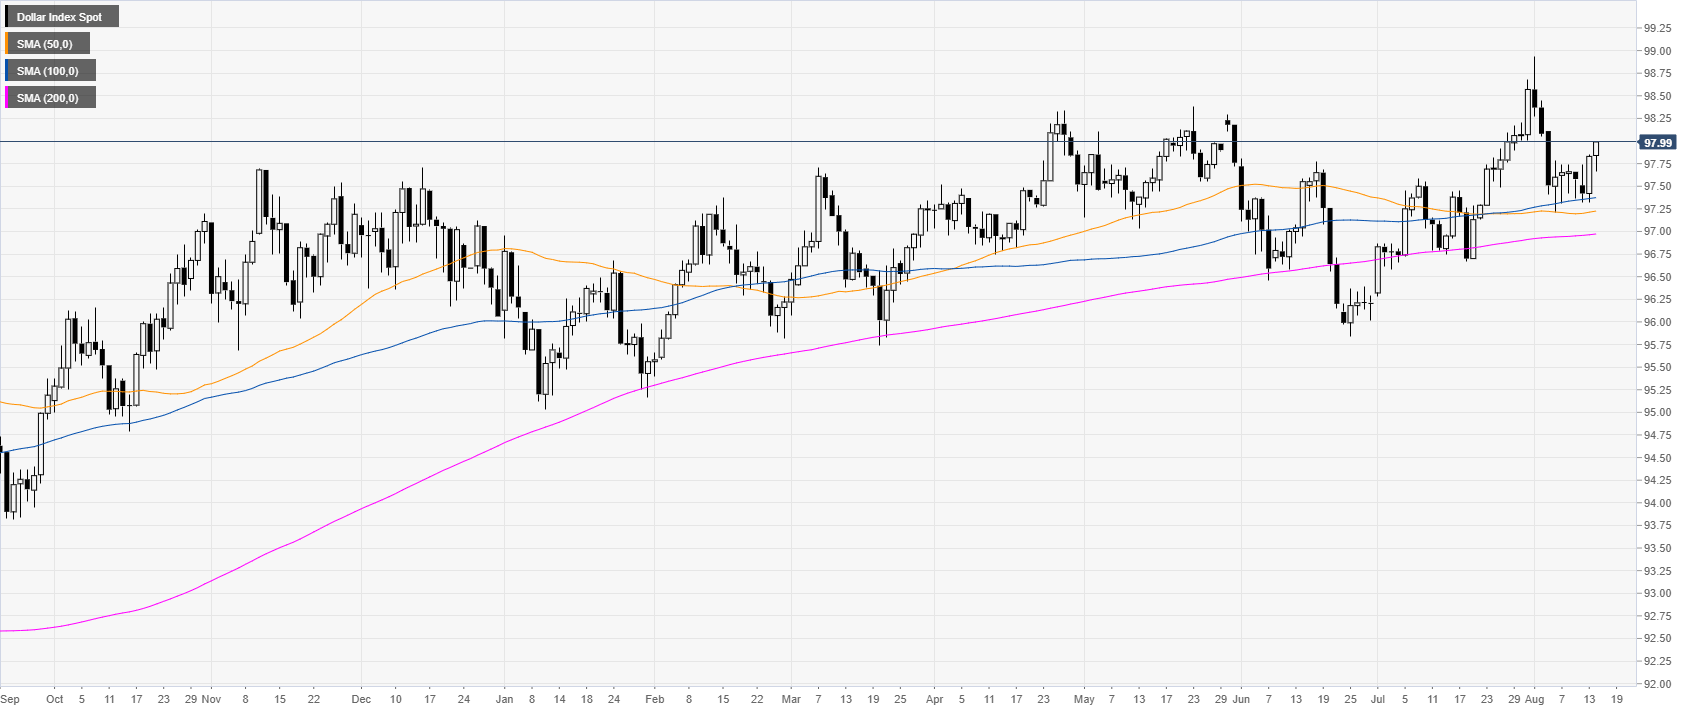
DXY daily chart
DXY (US Dollar Index) is trading in a bull trend above its main daily simple moving averages (DSMAs).
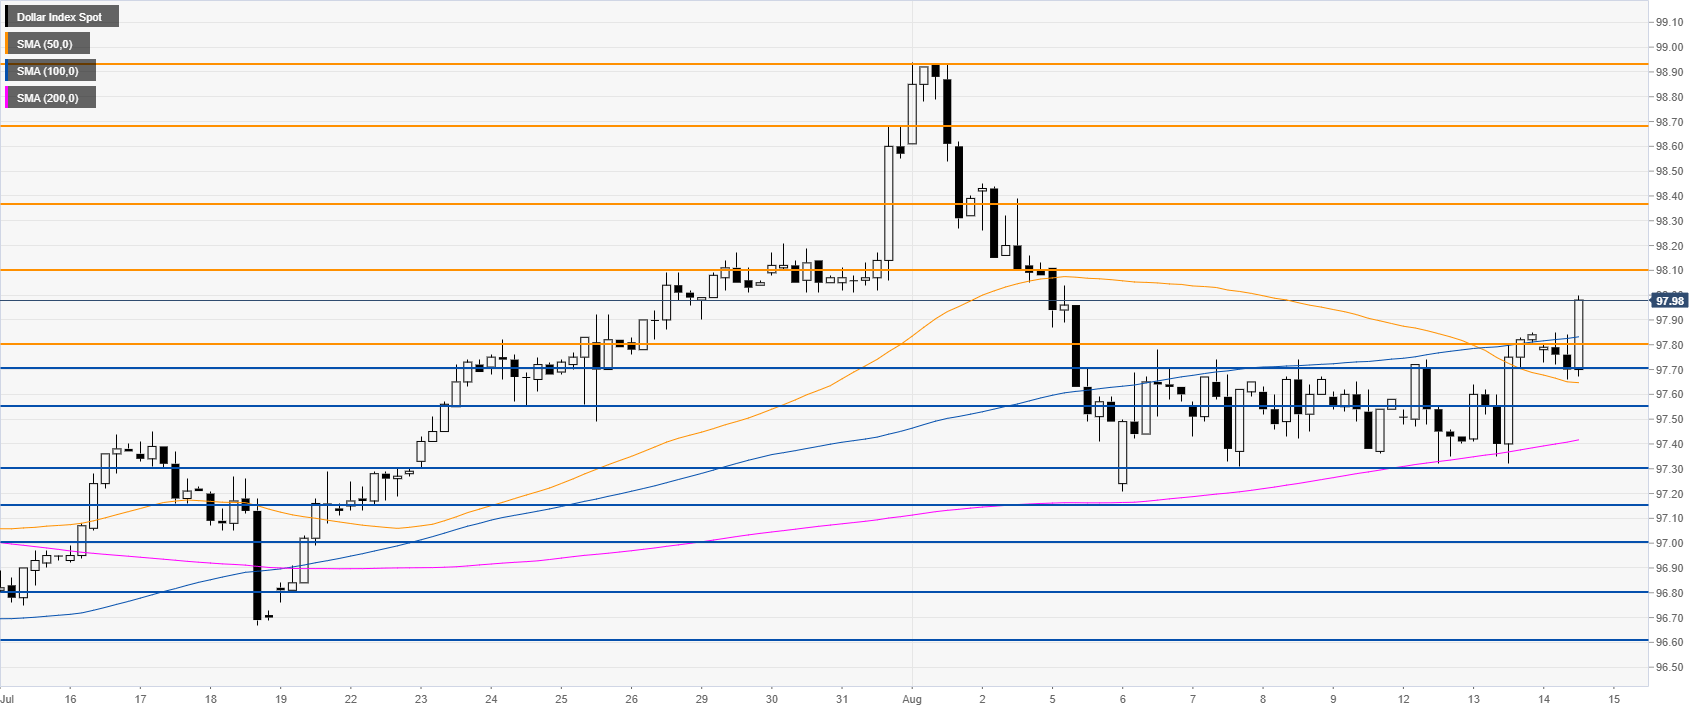
DXY 4-hour chart
The market is challenging the 98.00 figure while trading above its main SMAs. DXY bulls want to drive the market towards 98.10 resistance. Next targets include 98.38, 98.68 and the 98.93 level.
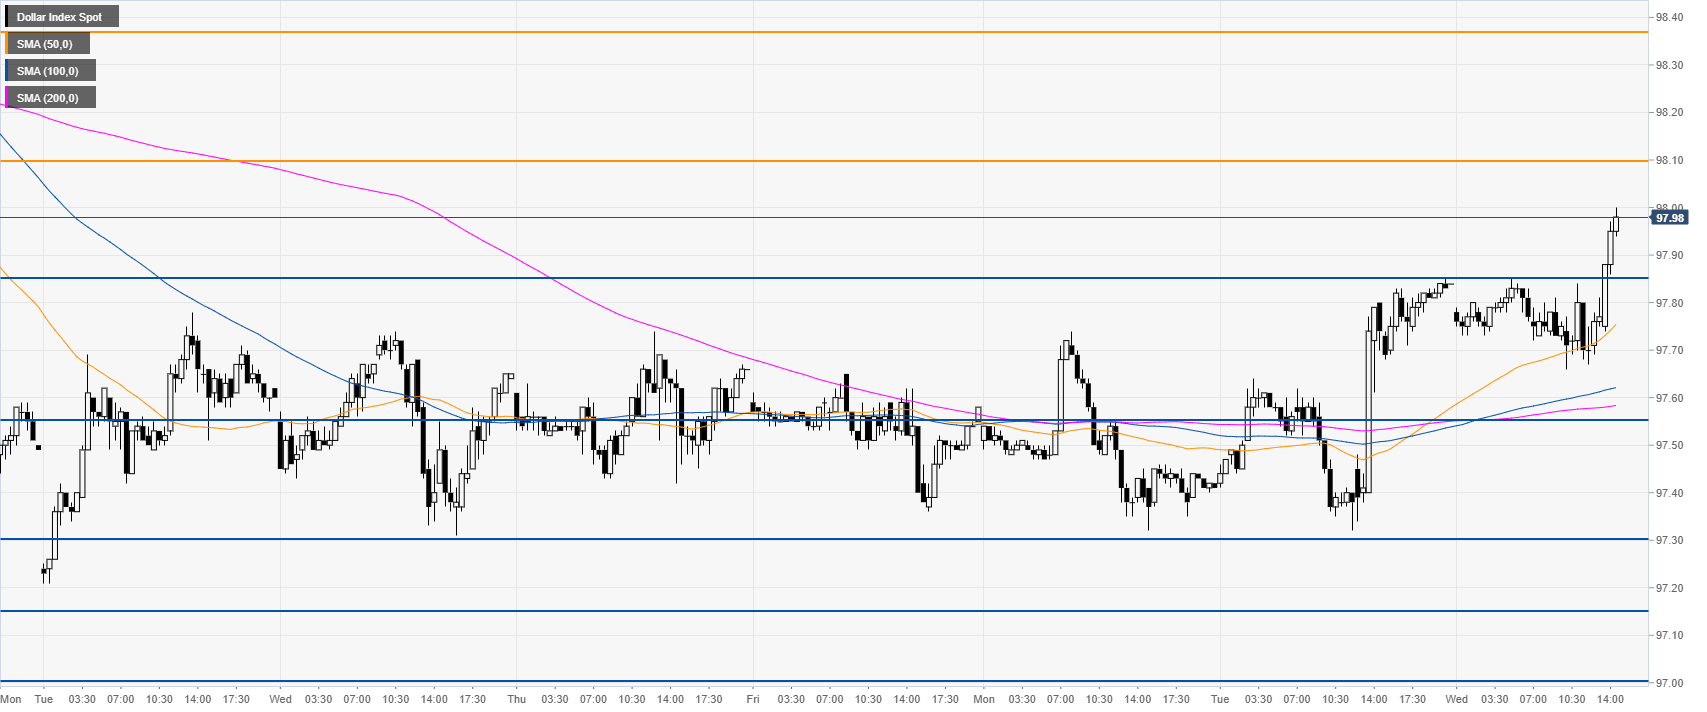
DXY 30-minute chart
The buying pressure is lifting the Greenback to daily highs. Immediate support could be found near 97.85 and 97.55.
Additional key levels
