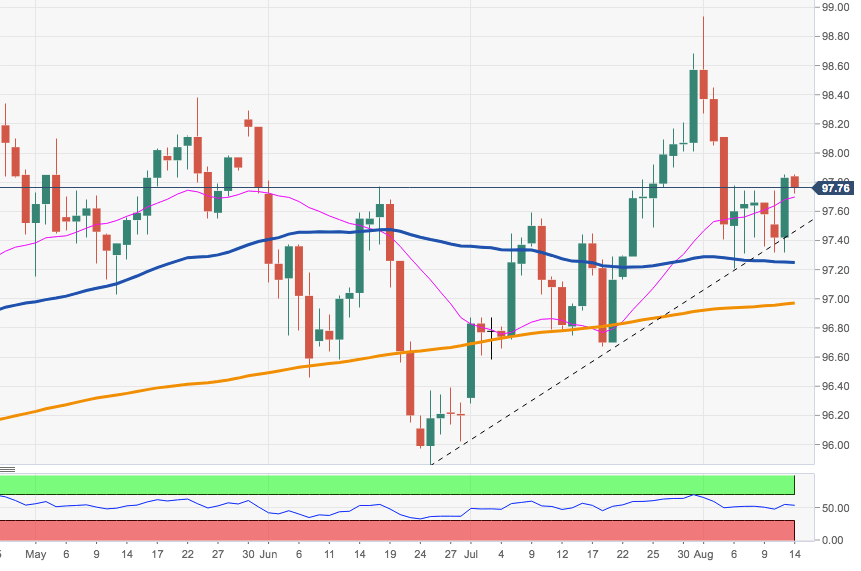
- DXY has met quite a tough hurdle in the 97.85/90 band, or weekly highs.
- In this area of initial resistance sits a Fibo retracement of the 2017-2018 drop (97.87) ahead of 2019 high at 98.93 (August 1).
- If sellers regain the upper hand in the near term, the 97.20 region should offer interim contention. In this area coincide recent lows and the 55-day SMA.
DXY daily chart