- AUD/JPY remains below 23.6% Fibonacci retracement, 100-HMA.
- One-week old support-line will be next on sellers’ radar.
- Two-day long descending trend-line offers additional upside cap.
With the confluence of 100-hour moving average (HMA) and 23.6% Fibonacci retracement of July-end to early-August downpour limiting the AUD/JPY pair’s near-term upside, sellers target immediate support-line during further weakness. The quote takes the rounds to 71.40 during the early Asian session on Thursday.
Ahead of meeting an upward sloping trend-line since August 07, at 71.06, prices may take a halt around the recent low of 71.25.
However, a downside break of 71.06, also clearing the 71.00 round-figure, might not refrain from challenging monthly bottom surrounding 70.70.
Meanwhile, two-day-old resistance-line at 71.86 acts as an additional upside barrier should the 71.70/71 confluence falls short of restricting the recovery.
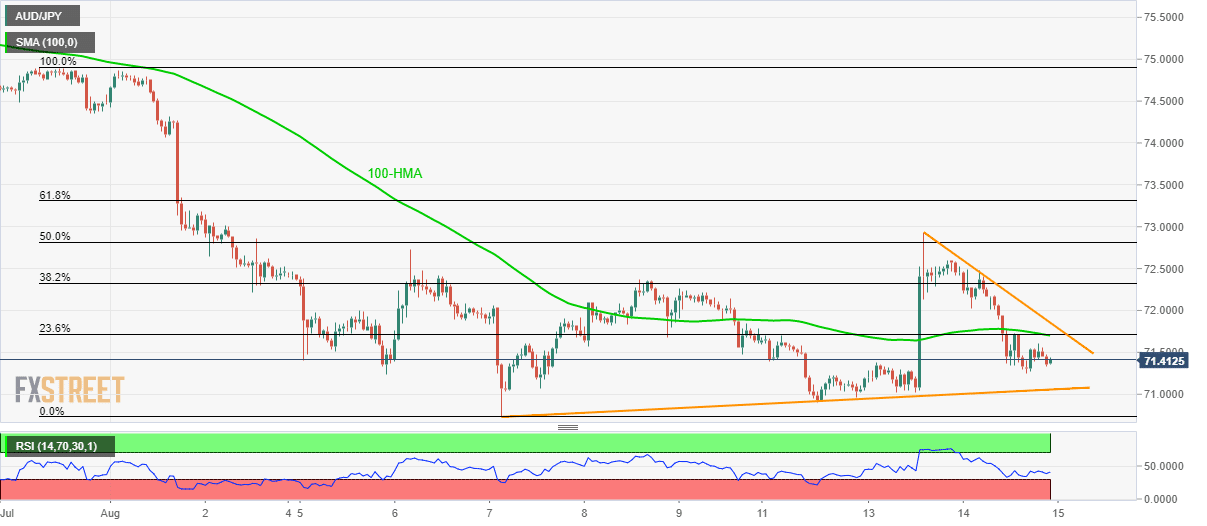
AUD/JPY hourly chart
Trend: Bearish
