- DXY (US Dollar Index) is starting the week quietly holding above the 98.10 level.
- The next potential targets on the way up could be located at 98.68 and 98.93 (2019 high).
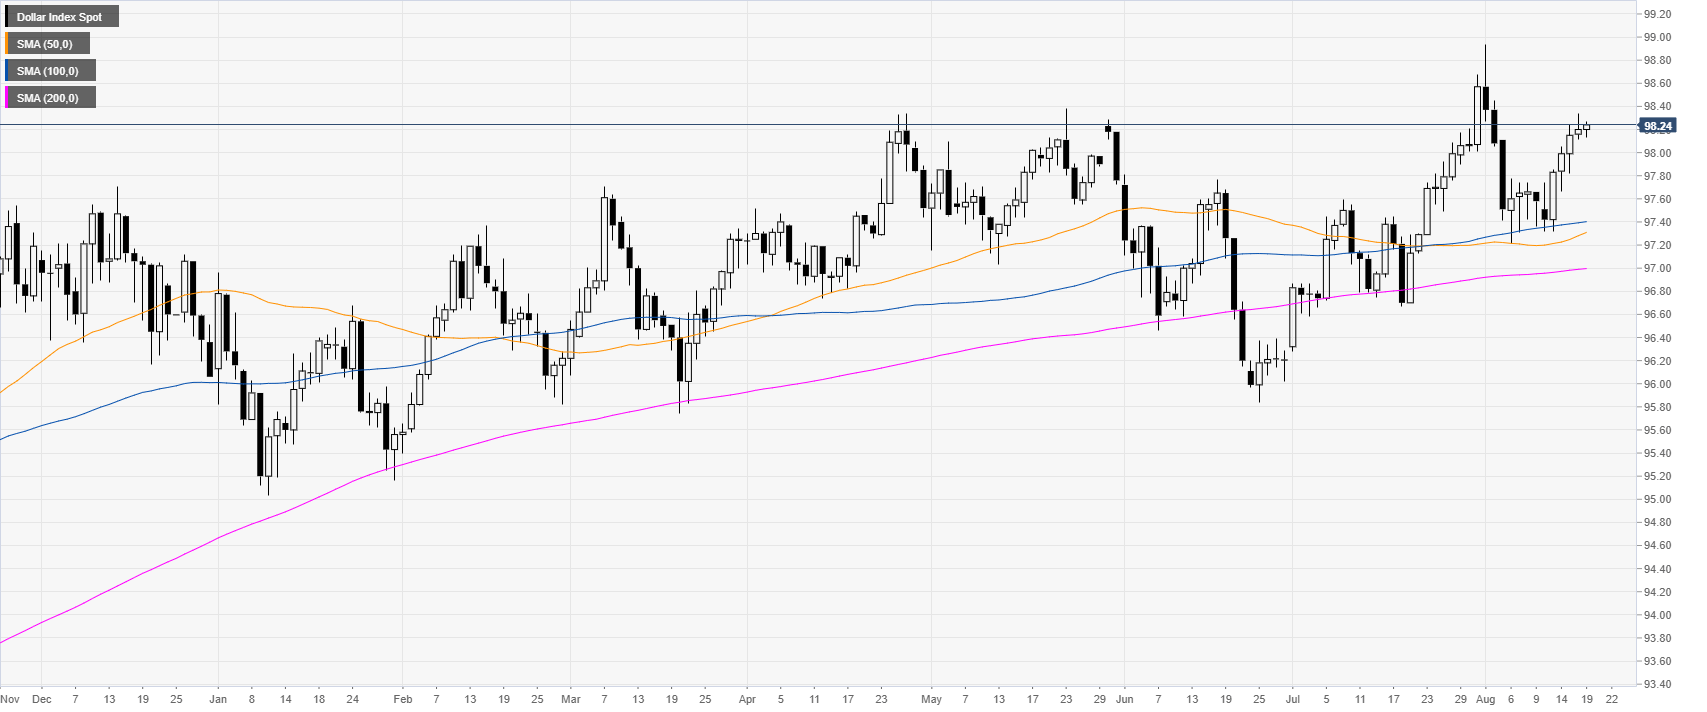
DXY daily chart
DXY (US Dollar Index) is in a bull trend above its main daily simple moving averages (DSMAs). The Greenback is trading withing Friday range on a quiet Monday.
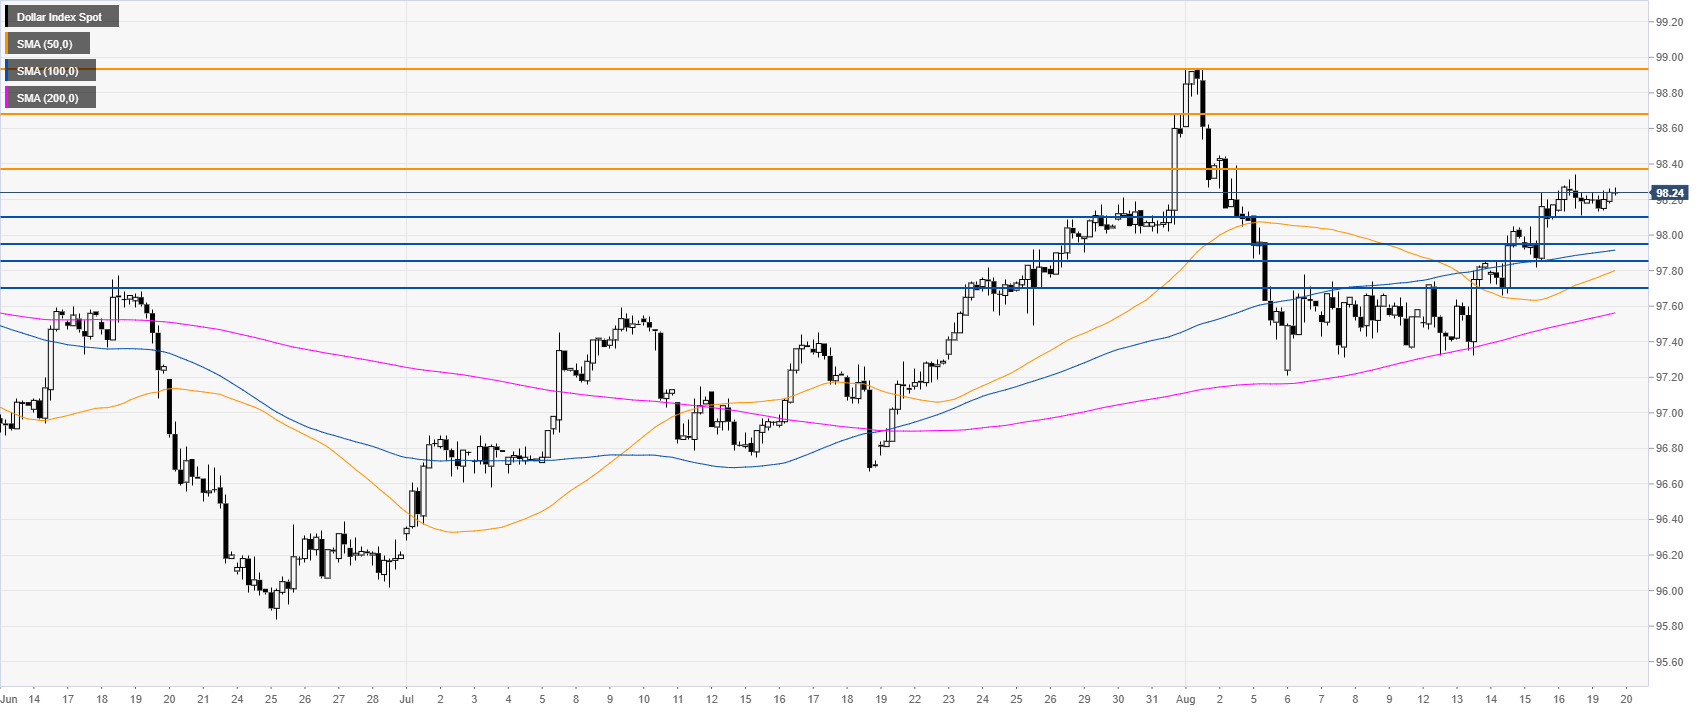
DXY 4-hour chart
The market is grinding up above its main SMAs. DXY bulls need to have a daily close above 98.38 to trade towards 98.68 and the 98.93 level (2019 high).
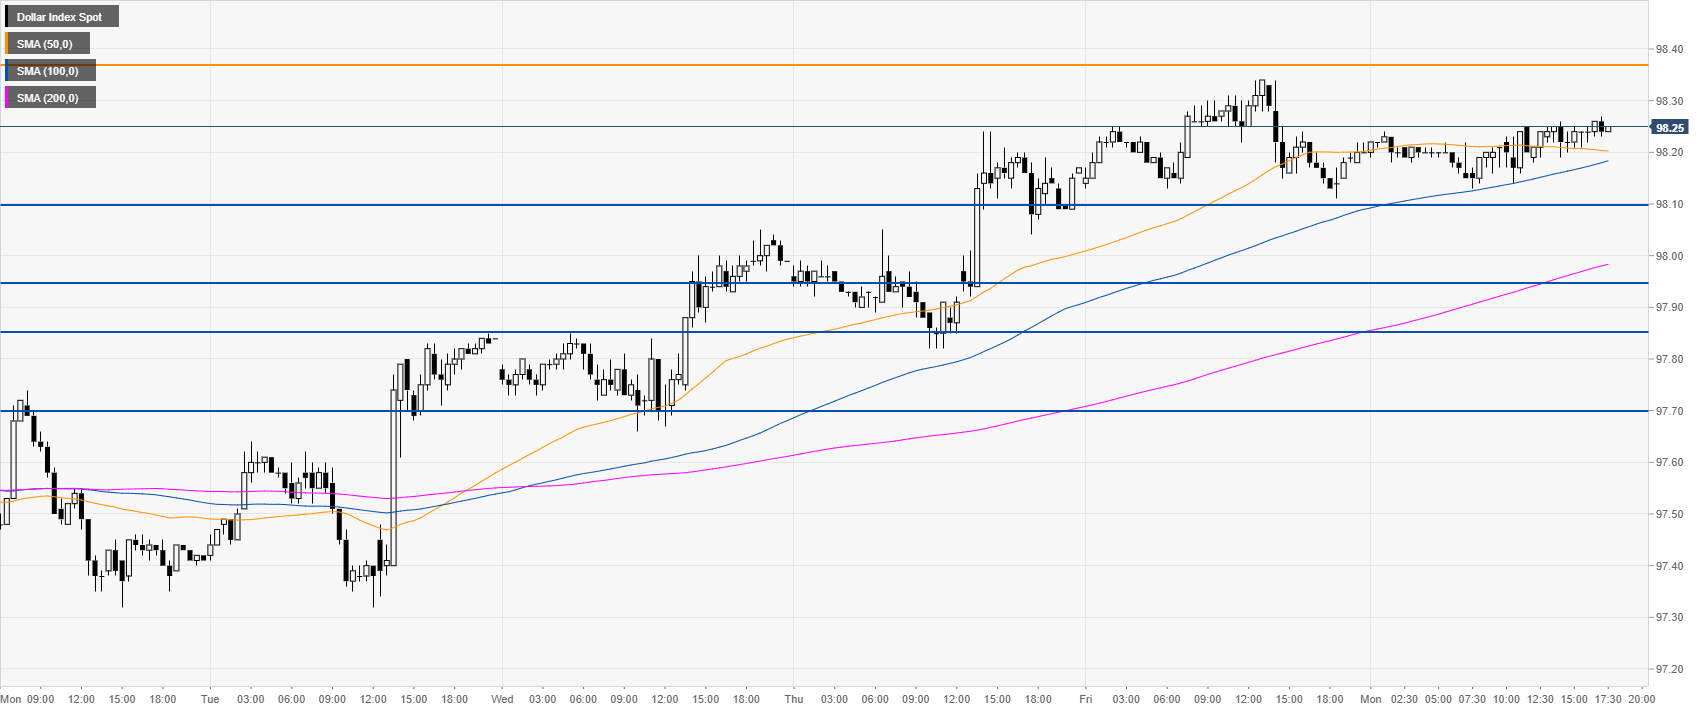
DXY 30-minute chart
The Greenback is trading above its main SMAs, suggesting bullish momentum. Immediate support could be found near the 98.10, 97.95 and 97.85 levels.
Additional key levels
