- USD/IDR seesaws near 50% Fibonacci retracement of mid-July to the early-August run-up.
- Prices remain in the range between 14,360 and 14,150 despite the sustained break of 4H 200MA.
A successful break of 4H 200MA doesn’t much favor the USD/IDR pair as it trades inside a short-term trading range while taking rounds to 14,235 on early Monday.
38.2% Fibonacci retracement level of 14,320 can offer immediate resistance whereas the pair’s further upside will be capped by range-top close to 14,360.
61.8% Fibonacci retracement level near 14,150 works as range support, a break of which will again highlight 200-bar moving average on the four-hour chart (4H 200MA) surrounding 14,110.
While 14,443 and 14,583 can please buyers during the upside break, 14,070 and 14,000 will be on the sellers’ radar if the quote slips below 14,110.
USD/IDR 4-hour chart
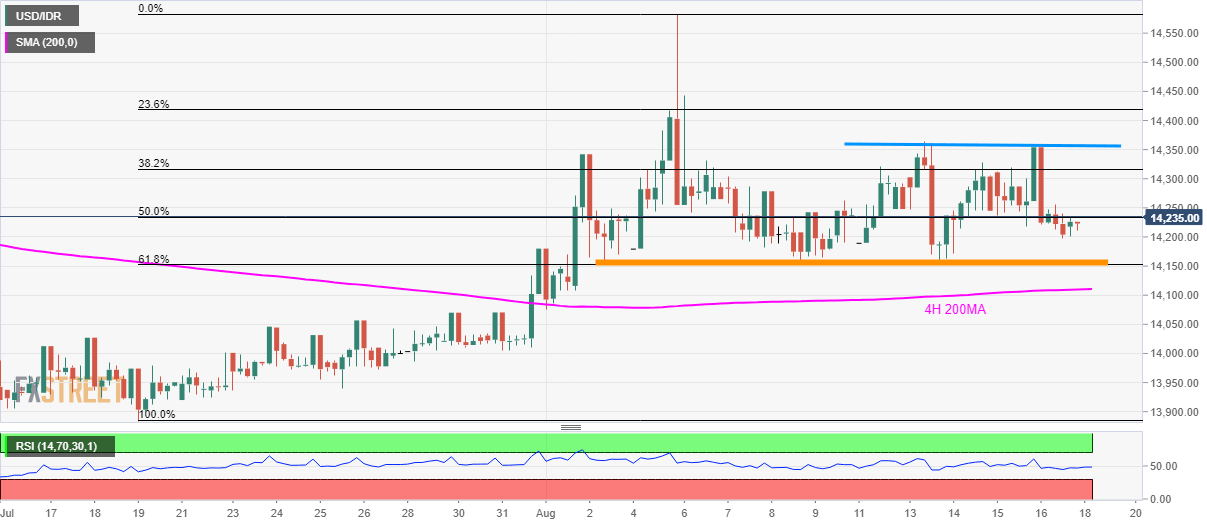
Trend: Sideways
