- GBP/USD loses upside momentum while reversing from 21-day SMA.
- 1.2100 becomes an immediate support to watch.
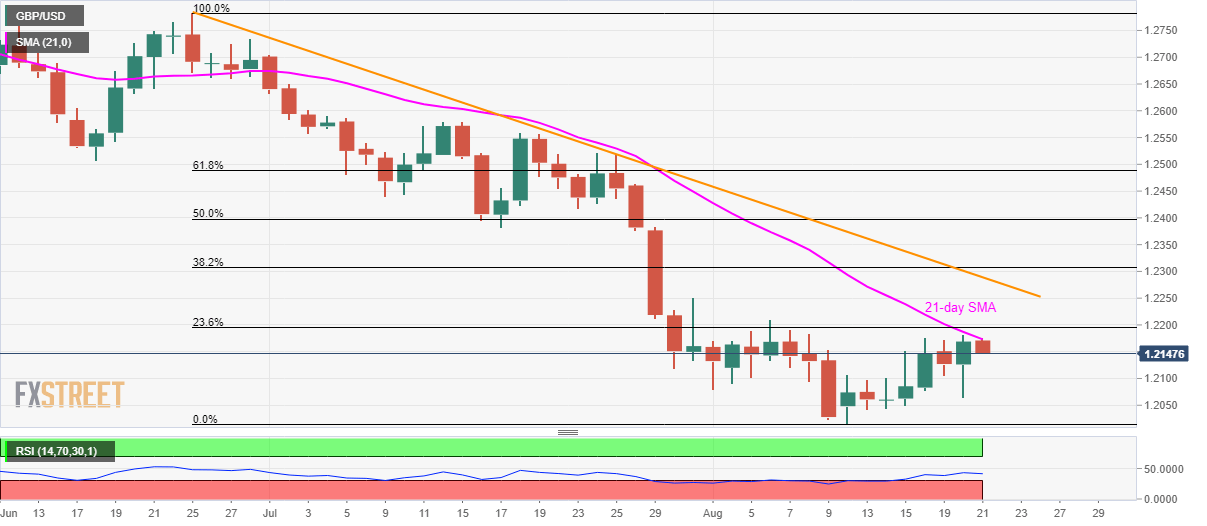
GBP/USD pulls back from the 21-day simple moving average (SMA) as it drops to 1.2150 heading into the UK open on Wednesday.
Buyers stay away unless the pair clear immediate upside barrier, namely 21-day SMA level of 1.2175. Even so, 23.6% Fibonacci retracement of June-August south-run, around 1.2200, and an eight-week-old descending trend-line at 1.2290 will challenge the upswing.
If at all bulls cross 1.2290 resistance, 50% Fibonacci retracement of 1.2400 will be on their radars.
Alternatively, multiple extremes marked since early-month highlight 1.2100 as a near-term key support, a break of which can fetch prices to 1.2060 and then to the monthly low of 1.2015.
Traders will also be mindful of the year 2016 low surrounding 1.1800 if prices extend downpour below 2017 bottom of 1.1987.
GBP/USD daily chart
Trend: Bearish
