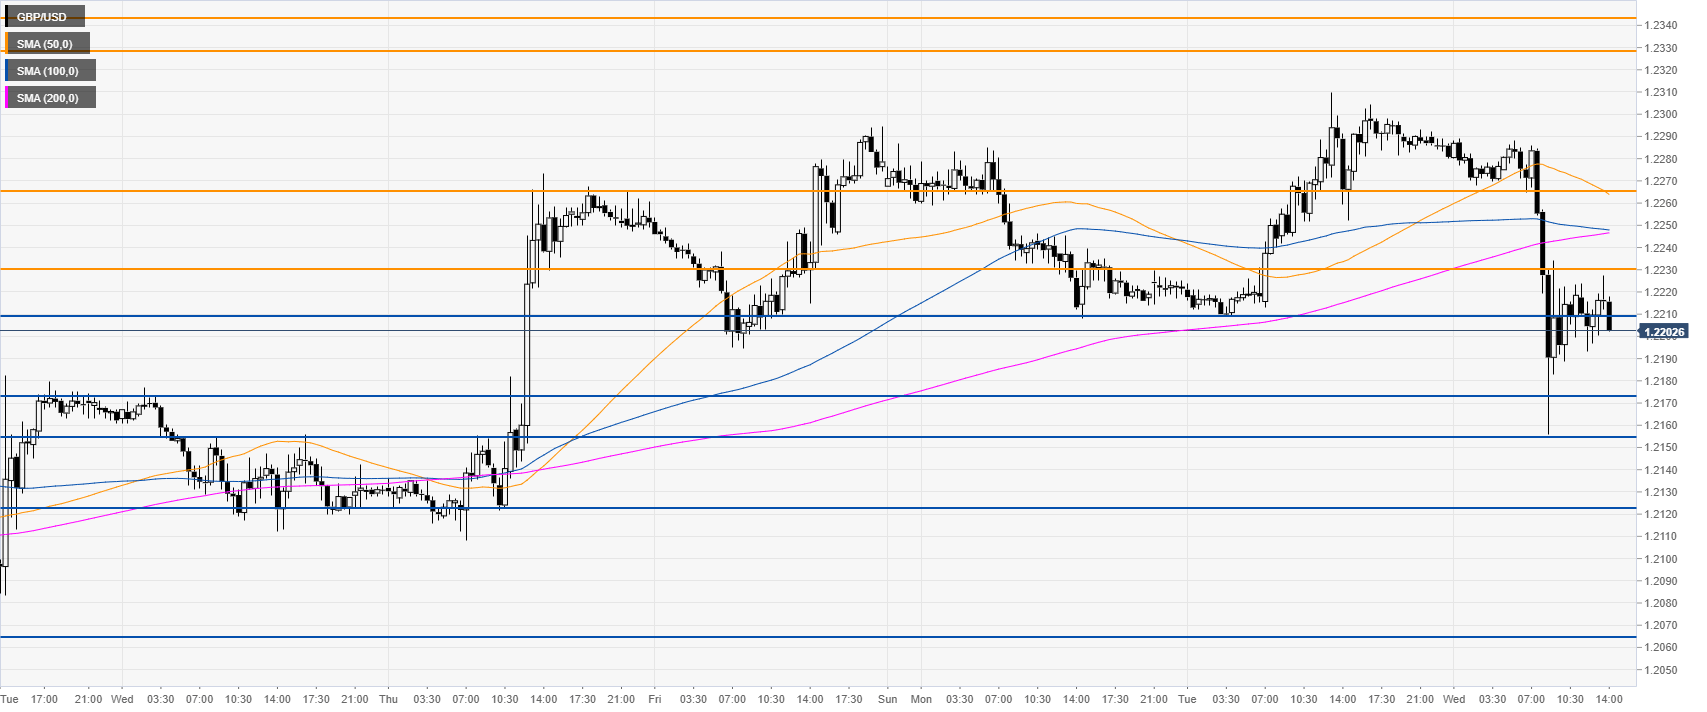
- GBP/USD is off the monthly highs after reaching 1.2310 on Tuesday.
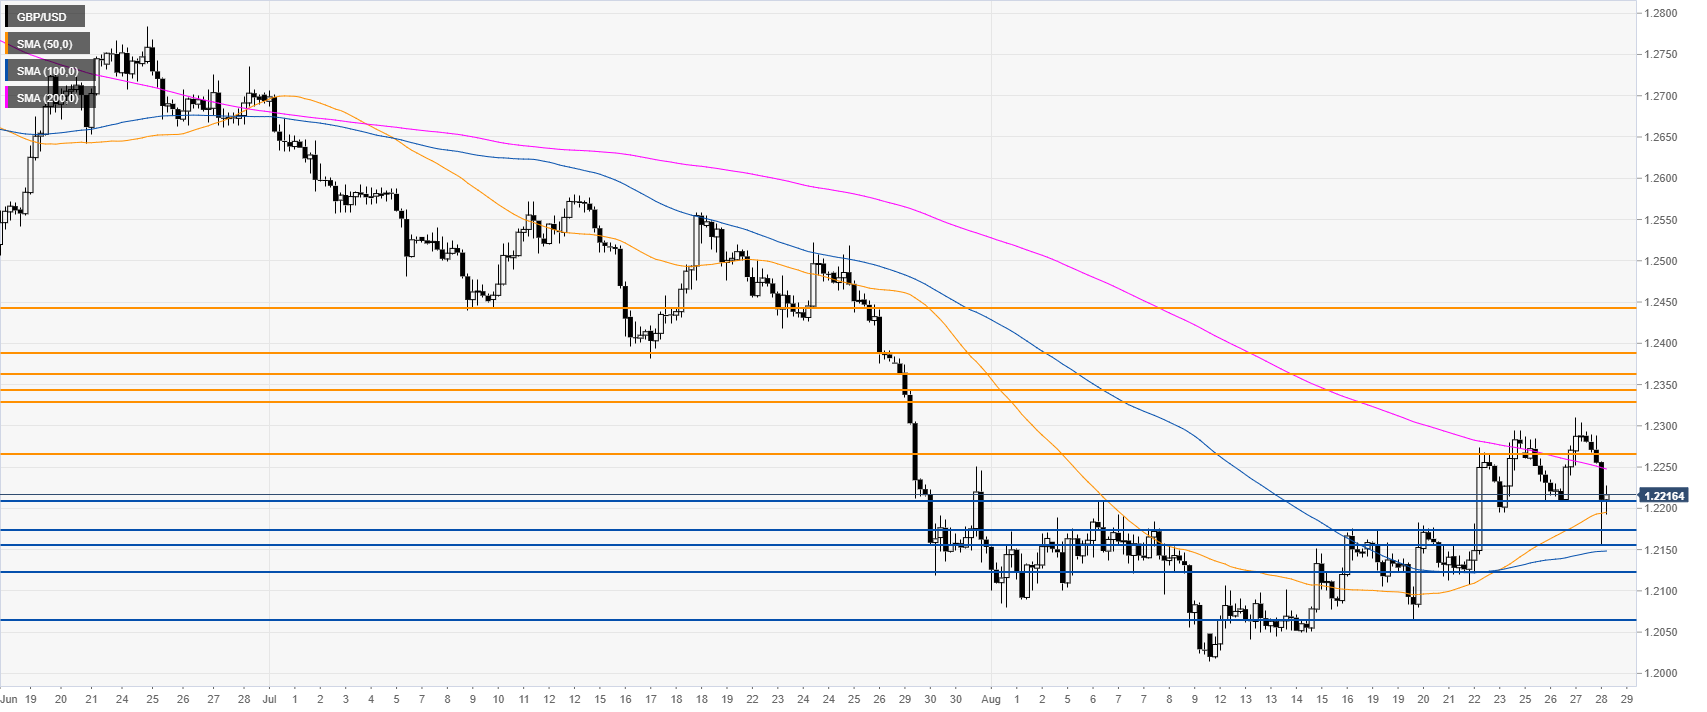
- The levels to beat for bears are seen at 1.2211, followed by 1.2173 support levels.
GBP/USD daily chart
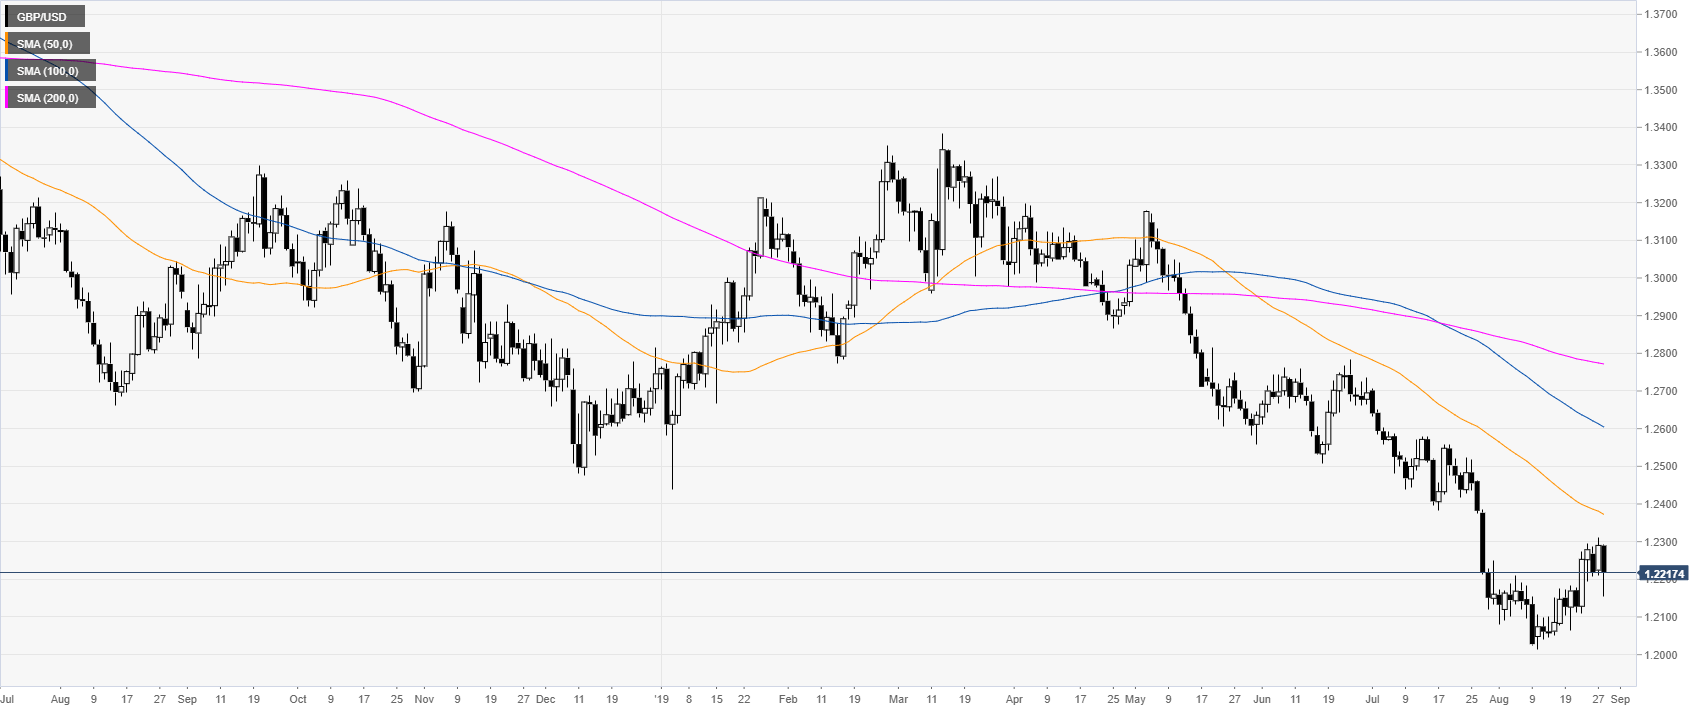
GBP/USD is in a bear trend below the main daily simple moving averages (SMAs). However, in the last two and a half weeks, the Cable has been reversing after printing a 2019 low at the 1.2015 level.
GBP/USD 4-hour chart
The Cable broke below the 1.2265 level and the 200 SMA on the 4-hour time frame. The market is now challenging the 1.2211 support and the 50 SMA. If the bears keep the pressure on, they can drive the market towards 1.2173, 1.2122 and 1.2065 levels, according to the Technical Confluences Indicator.
GBP/USD 30-minute chart
GBP/USD is trading below its main SMAs, suggesting bearish momentum in the near term. Immediate resistances are seen at 1.2230 and 1.2265 levels, according to the Technical Confluences Indicator.
Additional key levels


