- WTI is accelerating down below the 54.00 figure.
- The level to beat for bears is $53.00 a barrel.
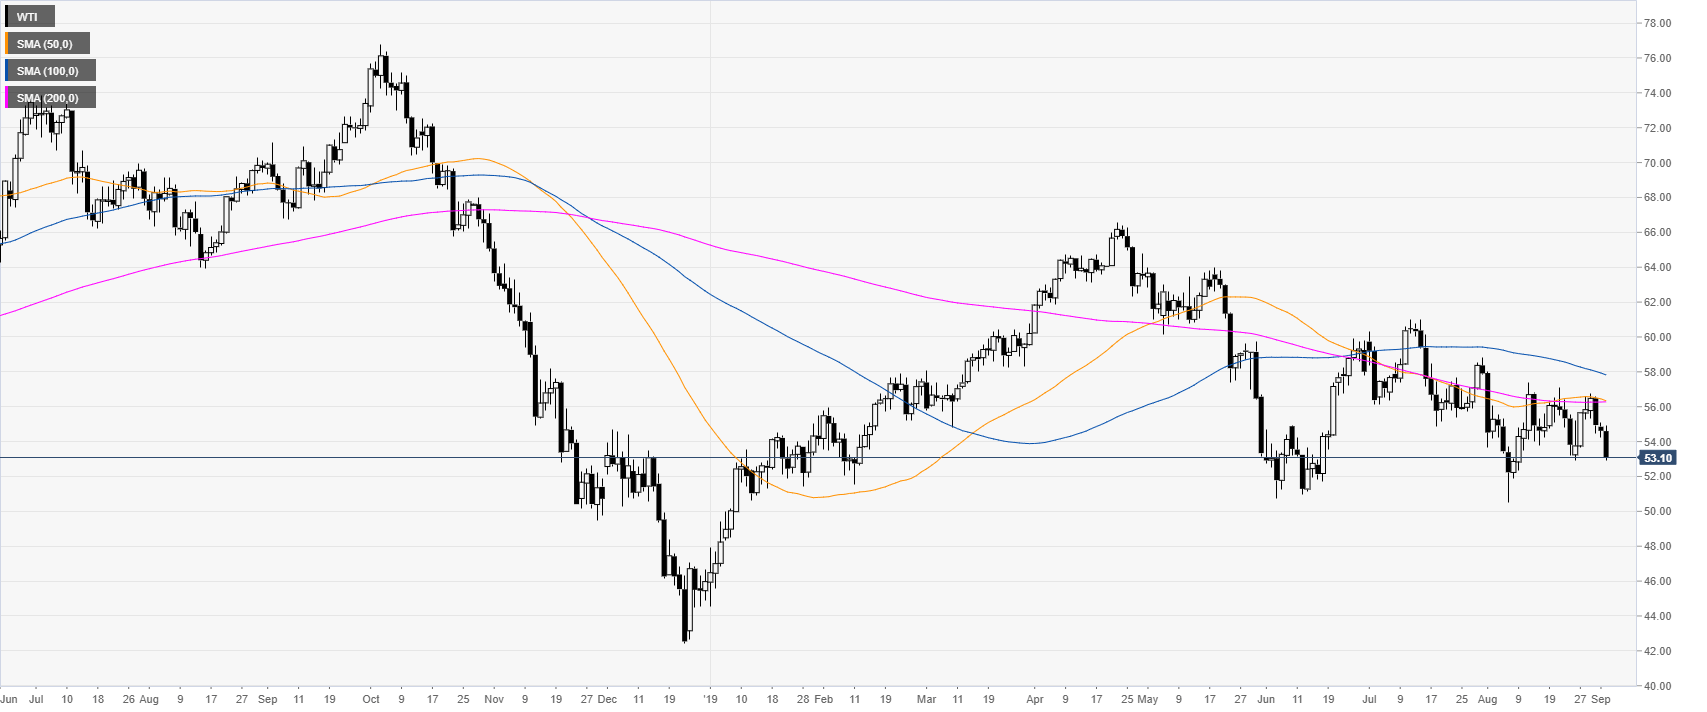
Oil daily chart
WTI (West Texas Intermediate) is trading in a bear trend below its main daily simple moving averages (SMAs).
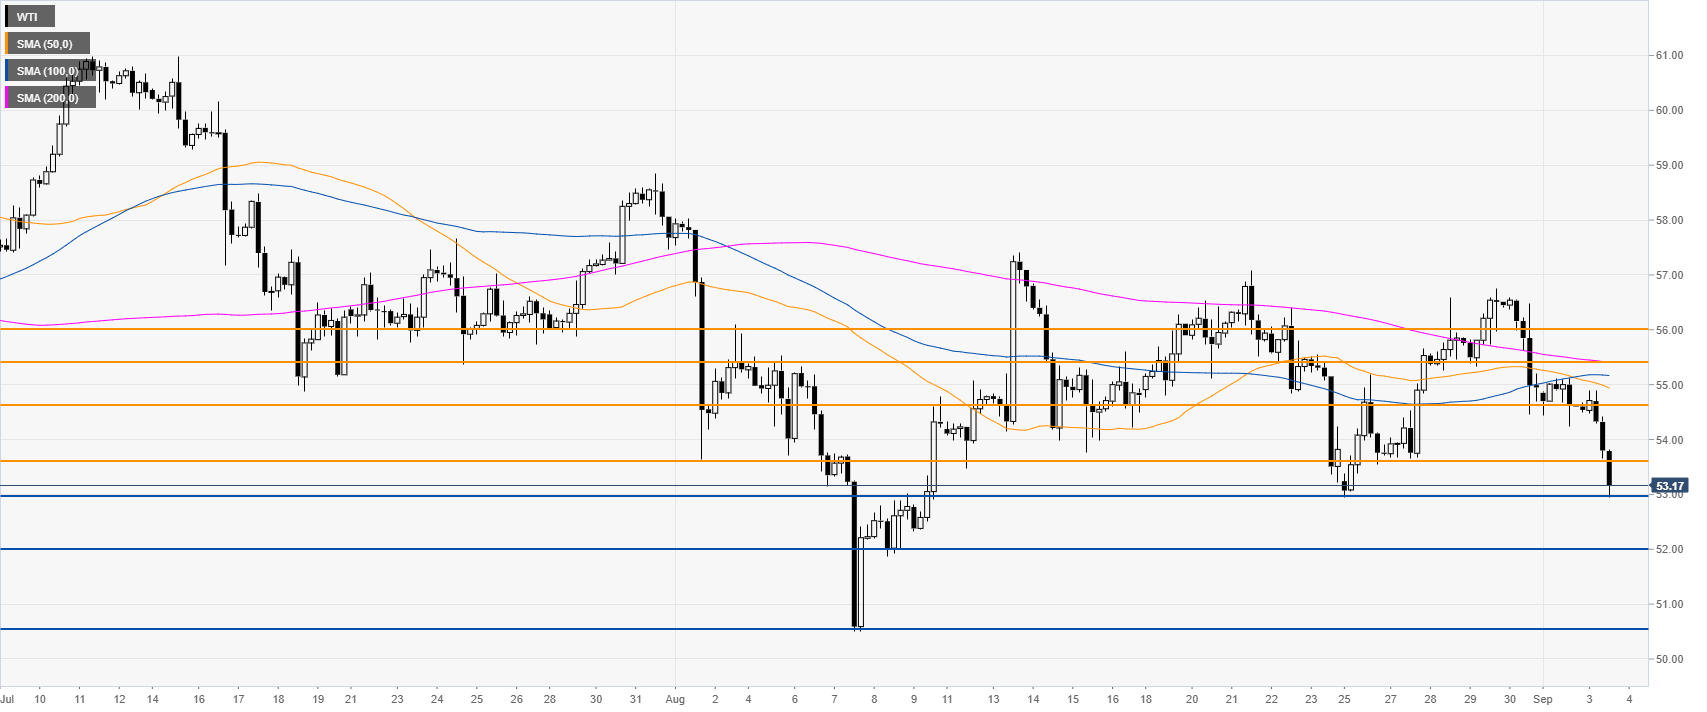
Oil 4-hour chart
WTI is challenging the 53.00 level while trading below the main SMAs suggesting bearish momentum in the medium term. Bears would need to overcome the 53.00 support to reach 52.00 and 50.50 on the way down.
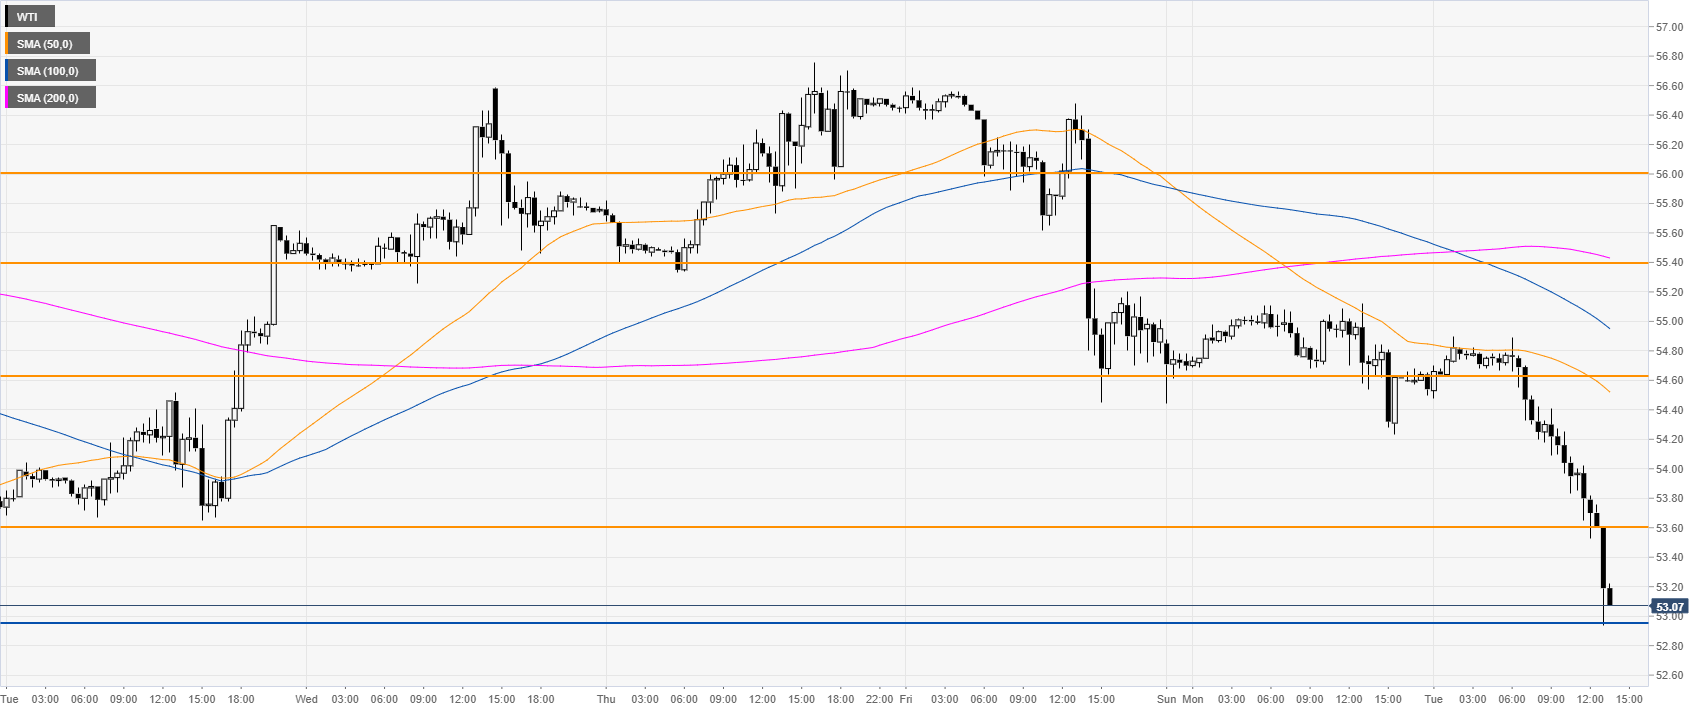
Oil 30-minute chart
Oil is trading below its main SMAs, suggesting bearish momentum in the near term. Black gold could find immediate resistance at the 53.60 and 54.60 levels.
Additional key levels
