- After breaking nearly a month-old falling trend-line, NZD/USD trades close to a week’s high.
- 21-DMA, 23.6% Fibonacci retracement seems buyers’ immediate target.
Having successfully breached a downward-sloping trend-line since August 09, NZD/USD takes the bids to a week’s high, around 0.6370, during early Thursday.
The quote now heads to 0.6392/94 confluence including 21-day simple moving average (DMA) and 23.6% Fibonacci retracement of late-July high to Tuesday’s low.
Supporting the upside momentum is a bullish signal by 12-bar moving average convergence and divergence (MACD) indicator.
Given the buyers’ ability to cross 0.6394, also breaking the 0.6400 round-figure, 38.2% and 50% Fibonacci retracement levels near 0.6470 and 0.6530 can entertain them ahead of 50-DMA figure of 0.6543.
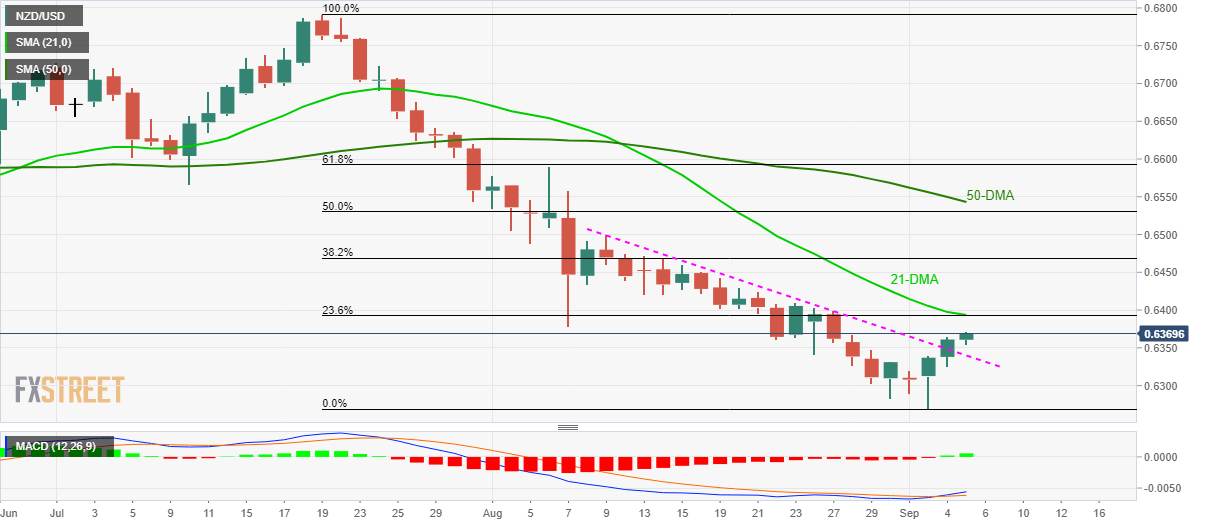
Alternatively, pair’s pullback below resistance-turned-support-line of 0.6340 can recall 0.6300 and Tuesday’s low near 0.6270 while 0.6200 might please bears then after.
NZD/USD daily chart
Trend: recovery expected
