- AUD/JPY fails to clear 50-day EMA despite upbeat Australia data.
- The pullback to 23.6% Fibonacci retracement can be expected.
- A falling trend-line since mid-April adds to the key resistances.
Although Australia’s July month Home Loans rallied past -0.80% prior (revised from -0.90%) to 5.0%, the AUD/JPY pair refrains from breaking 50-day EMA as it trades near 73.15 during Monday’s Asian session.
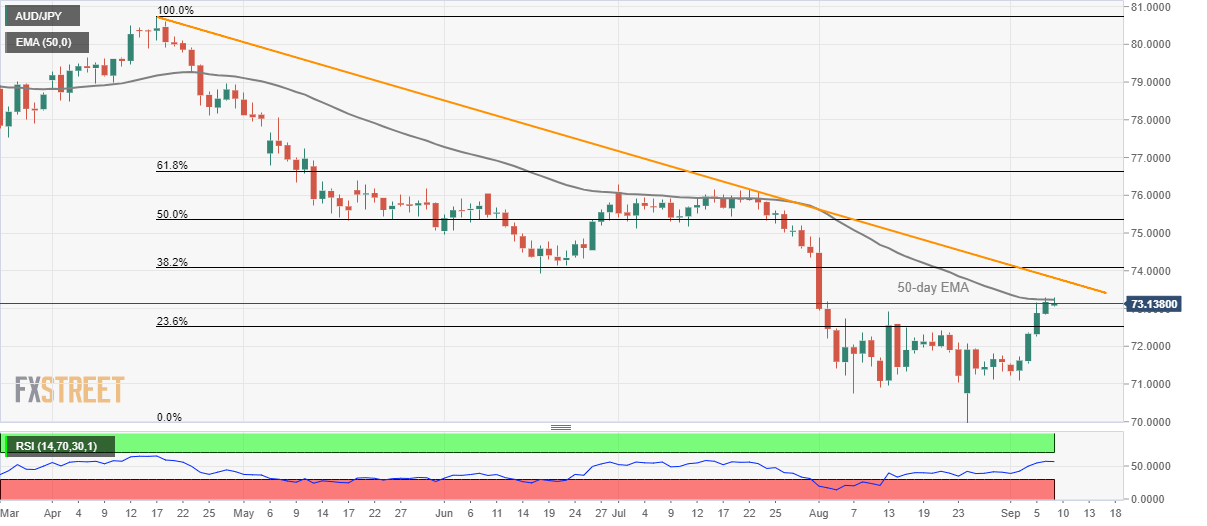
If at all the quote manages to rise past-73.25 level comprising 50-day exponential moving average (EMA), a downward sloping trend-line since April 17, at 73.72, could restrict further advances.
Pair’s repeated failures to cross key EMA increases the odds of a pullback to 23.6% Fibonacci retracement level of April-August declines, at 72.51. During the pair’s south-run below 72.51, late-August high surrounding 71.80 and August 06 low near 70.70 becomes the key as a break of which can recall 70.00 on the chart.
On the contrary, the 14-bar relative strength index (RSI) is strong above 50 level and indicates another confrontation to the key resistances.
AUD/JPY daily chart
Trend: pullback expected
