- The Sterling is consolidating its gains for the third consecutive day.
- The level to beat for bears is at 1.2313 support.
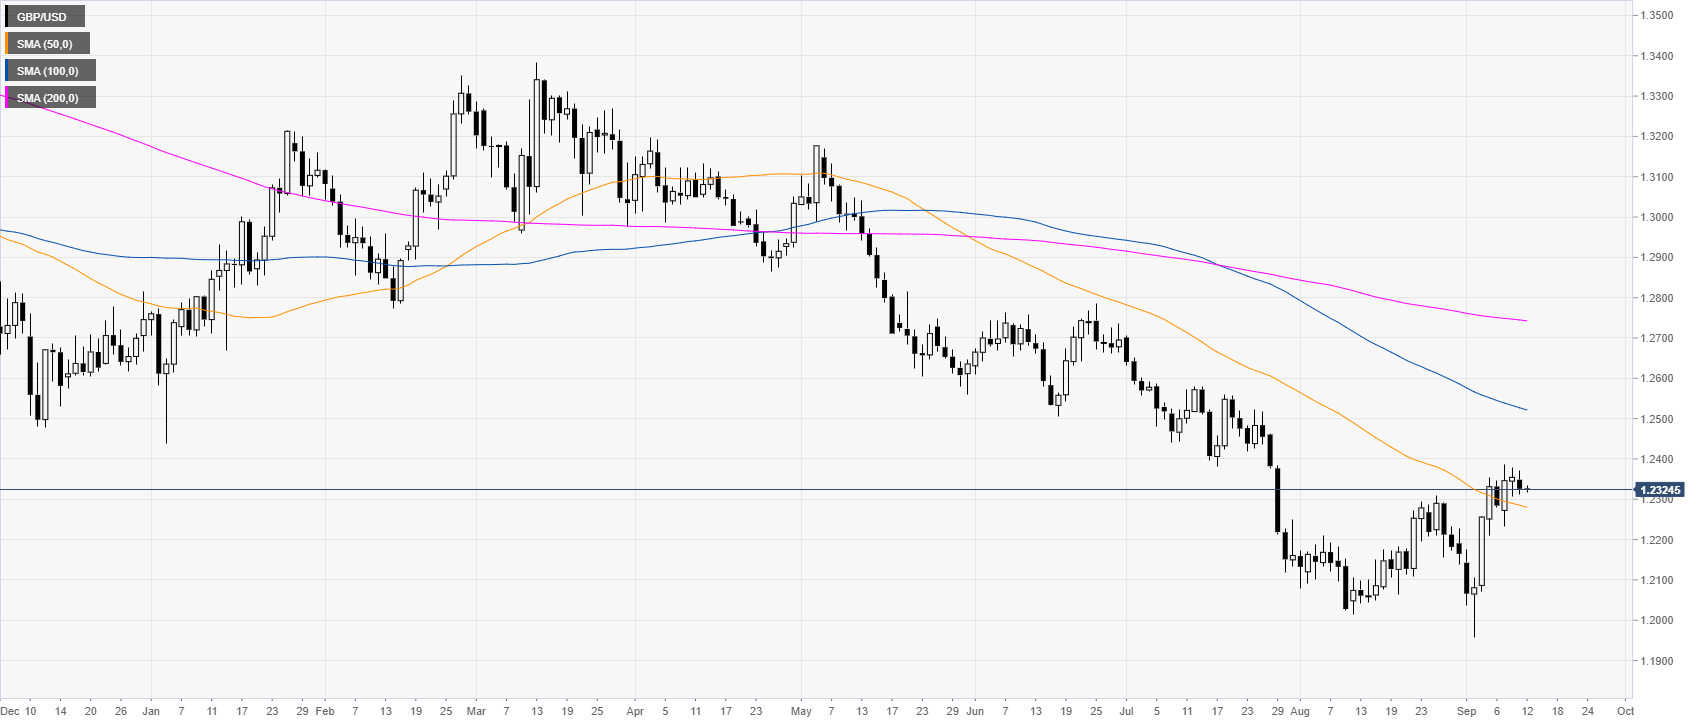
GBP/USD daily chart
The Pound is trading in a bear trend below the 100 and 200-day simple moving averages (SMAs). GBP/USD is consolidating its advance below the 1.2400 figure.
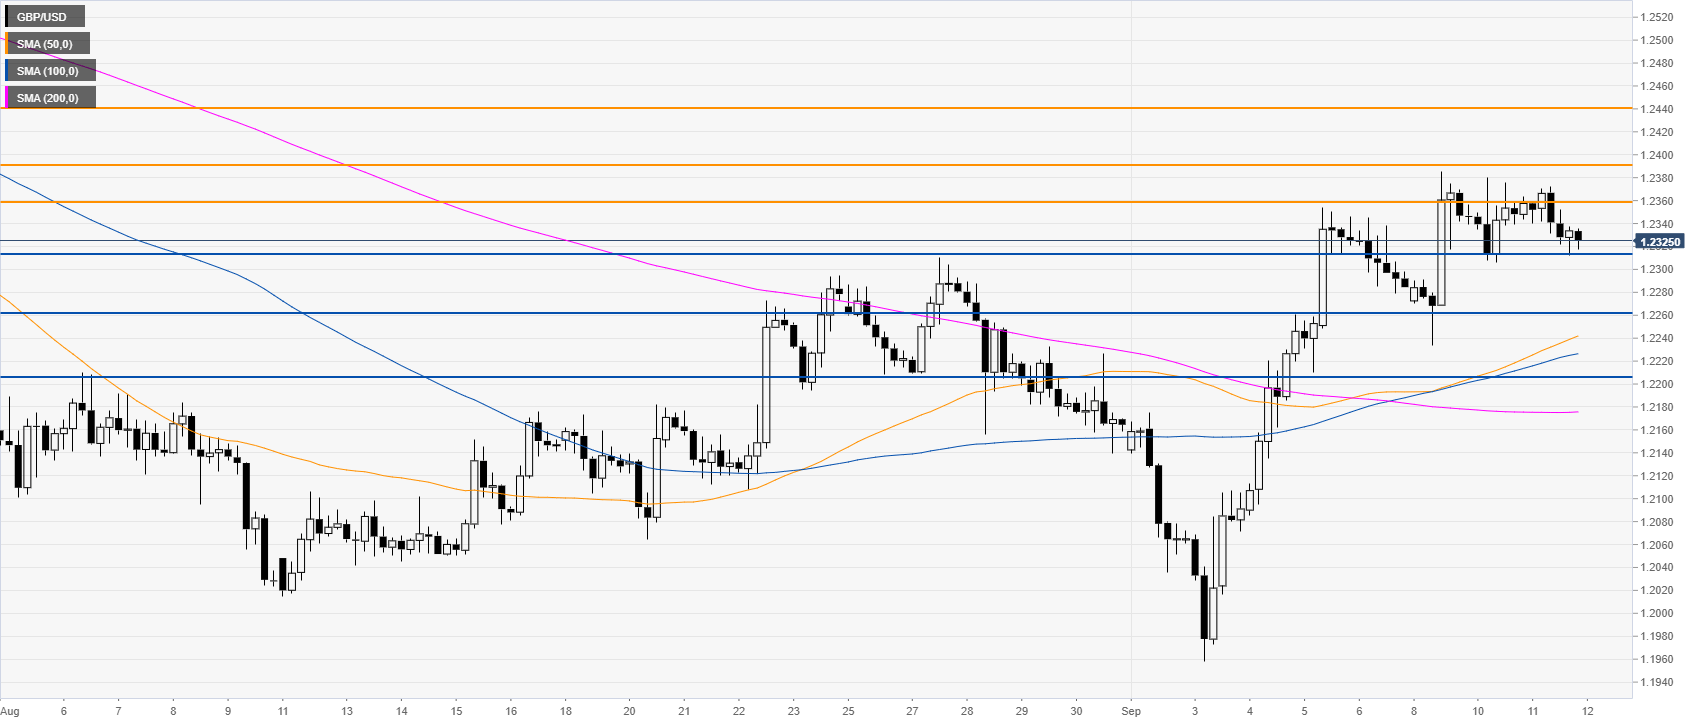
GBP/USD four-hour chart
GBP/USD is parked just above 1.2313 support as the market is trading above its main SMAs. Bulls need a daily close above the 1.2390 level to attract buying interest toward 1.2440 resistance levels, according to the Technical Confluences Indicator.
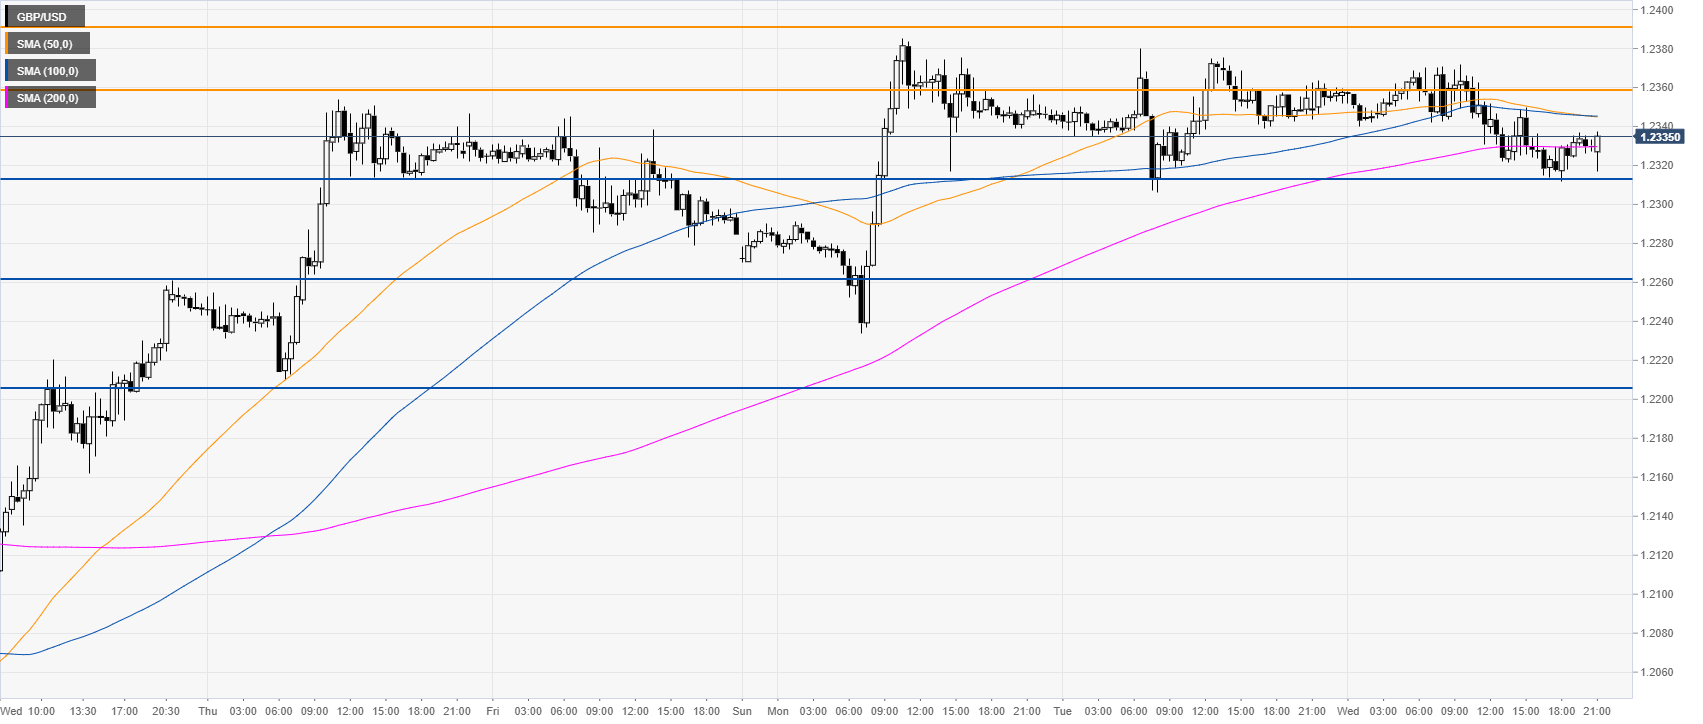
GBP/USD 30-minute chart
The Pound is trading just below the main SMAs, suggesting bearish momentum in the near term. Sellers are looking for a clear break of the 1.2313 key support to reach 1.2262 and 1.2205 levels to the downside, according to the Technical Confluences Indicator.
Additional key levels
