- The Sterling has been on a rollercoaster this Thursday as the marked dipped below 1.2300 and corrected up to 1.2360.
- The market is neutral to bearish trading within its weekly range.
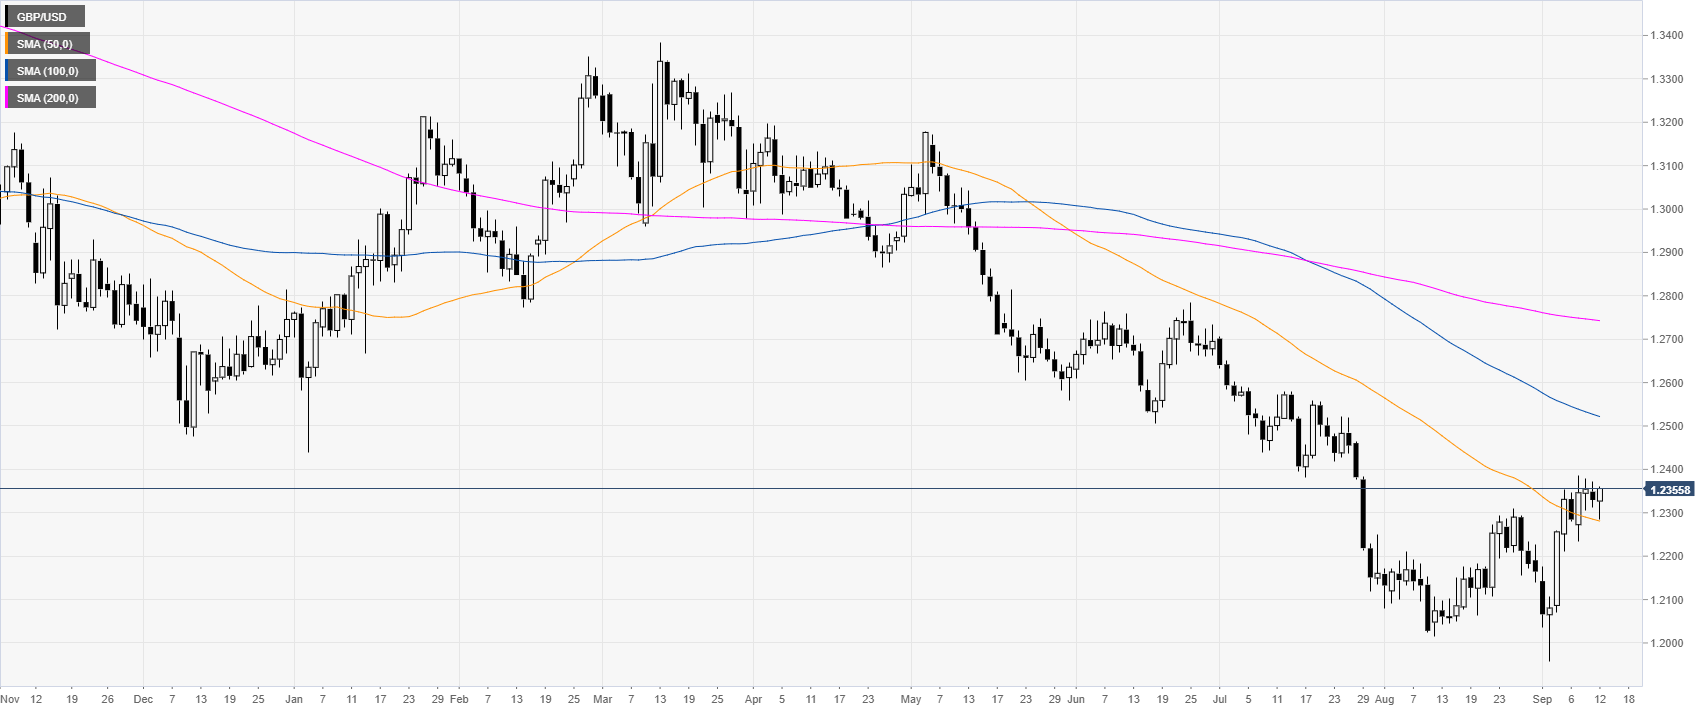
GBP/USD daily chart
The Pound is trading in a bear trend below the 100 and 200-day simple moving averages (SMAs). GBP/USD is in consolidation mode below the 1.2400 handle.
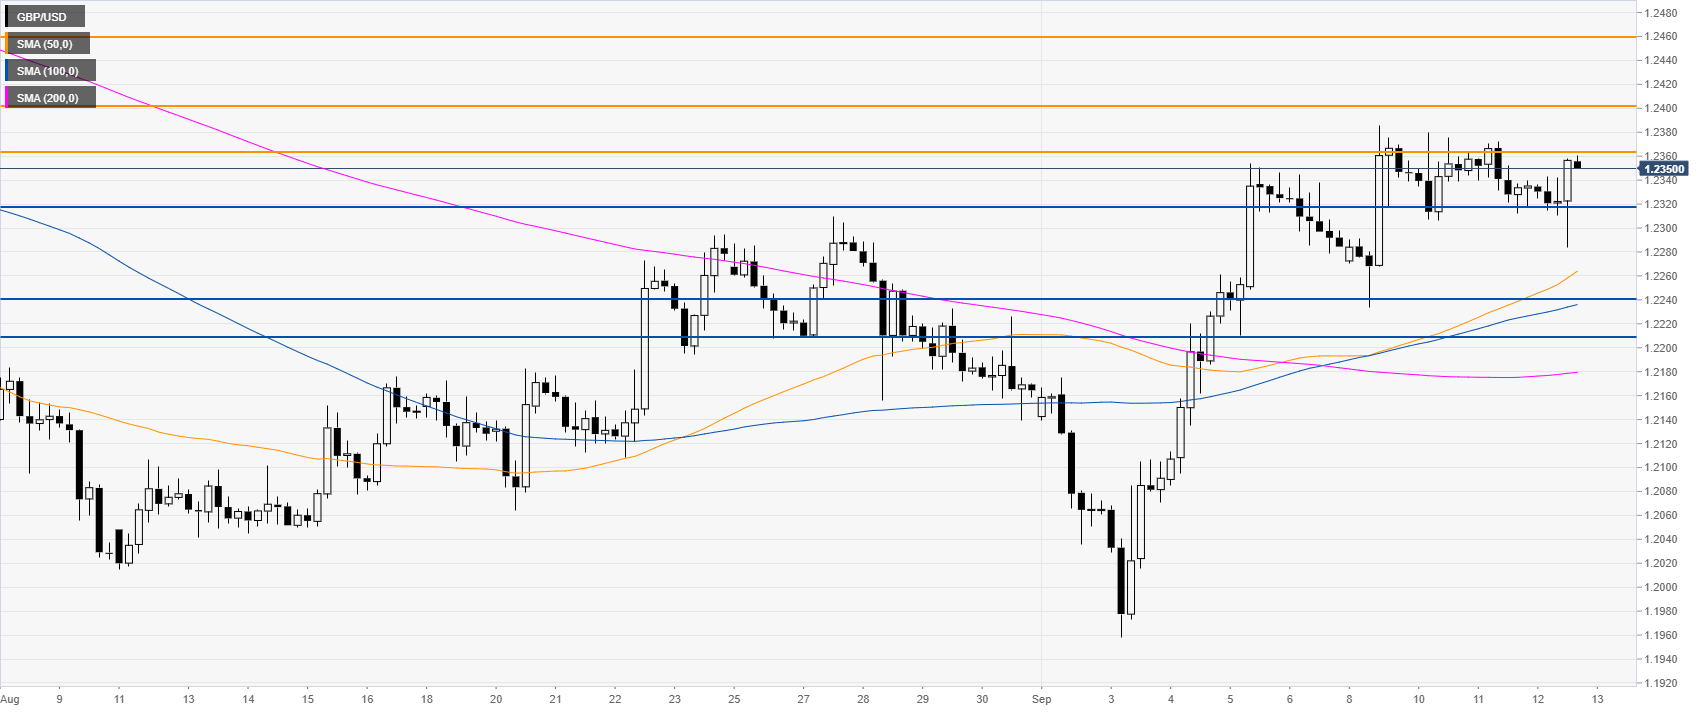
GBP/USD four-hour chart
GBP/USD had a sharp recovery to the 1.2360 level. Bulls are looking for a break above this level and more importantly a daily close above 1.2400 resistance which can open the doors to a run-up to the 1.2460 resistance, according to the Technical Confluences Indicator.
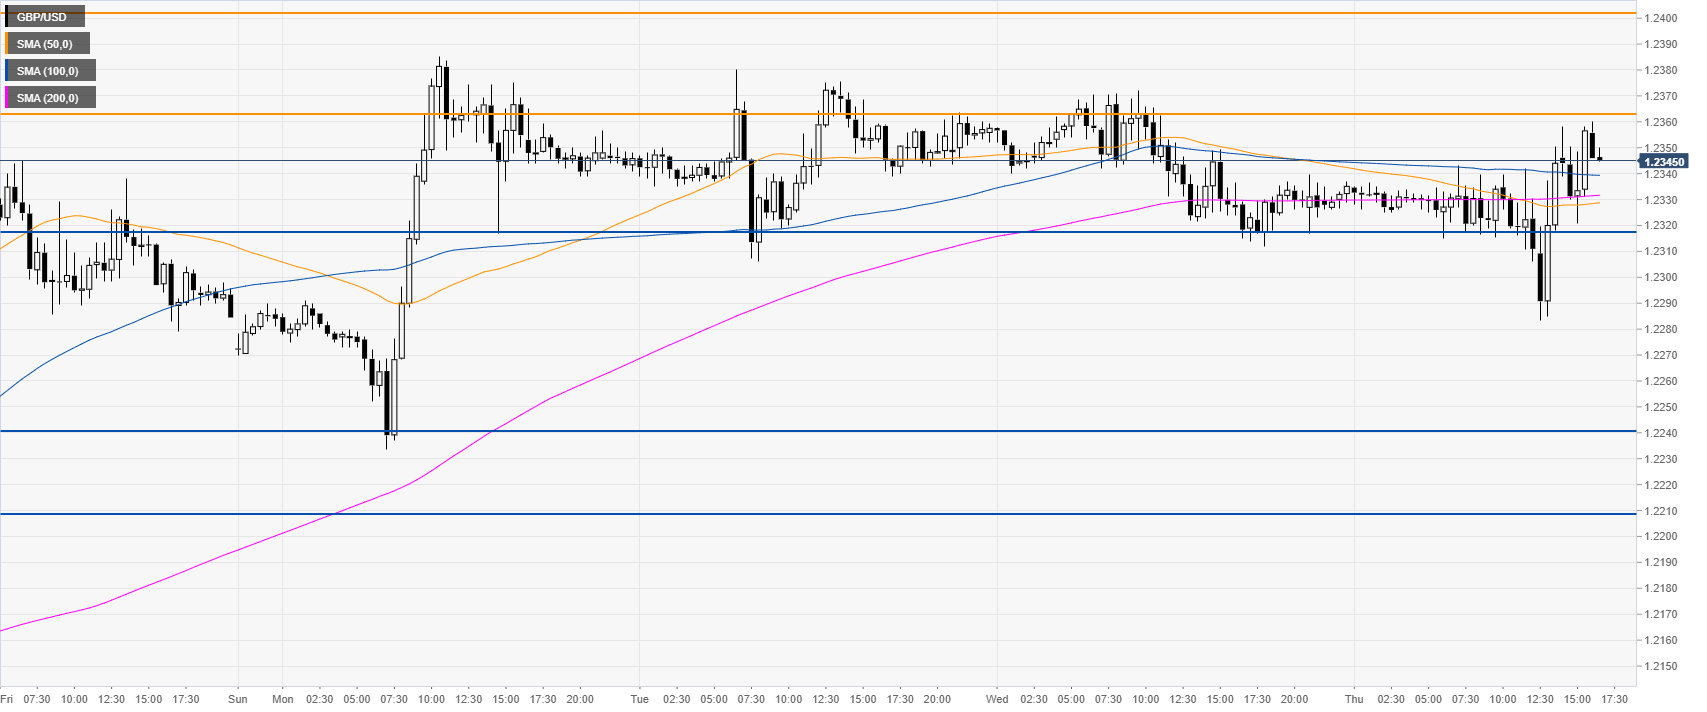
GBP/USD 30-minute chart
The Sterling is trading within its weekly range, suggesting neutral momentum in the short term. Bears would need a break below 1.2317 to open the doors for a run to 1.2240, according to the Technical Confluences Indicator.
Additional key levels
