- NZD/USD registers another bounce off 21-day EMA while staying below four-day-old horizontal resistance.
- Bullish MACD favors pair’s upside to 38.2% Fibonacci retracement, 50-day EMA.
With the majority of Antipodeans on their run-up, NZD/USD isn’t bucking the trend as it takes another U-turn from 21-day exponential moving average (EMA) while taking the bids to 0.6430 on early Thursday.
Even so, the pair is left to cross immediate horizontal resistance around 0.6445 in order to justify its strength to challenge 38.2% Fibonacci retracement of July-September south-run near 0.6470. Although, 50-day EMA level close to 0.6480 could question buyers then after.
Supporting the upside momentum is a bullish signal from 12-day moving average convergence and divergence (MACD) indicator. As a result, pair’s rise past-0.6480 could cross 0.6500 round-figure to aim for 50% Fibonacci retracement level of 0.6532.
Meanwhile, pair’s declines below 21-day EMA level of 0.6410 could quickly fetch the quote to 23.6% Fibonacci retracement level of 0.6395 and then towards month-start high surrounding 0.6320.
NZD/USD daily chart
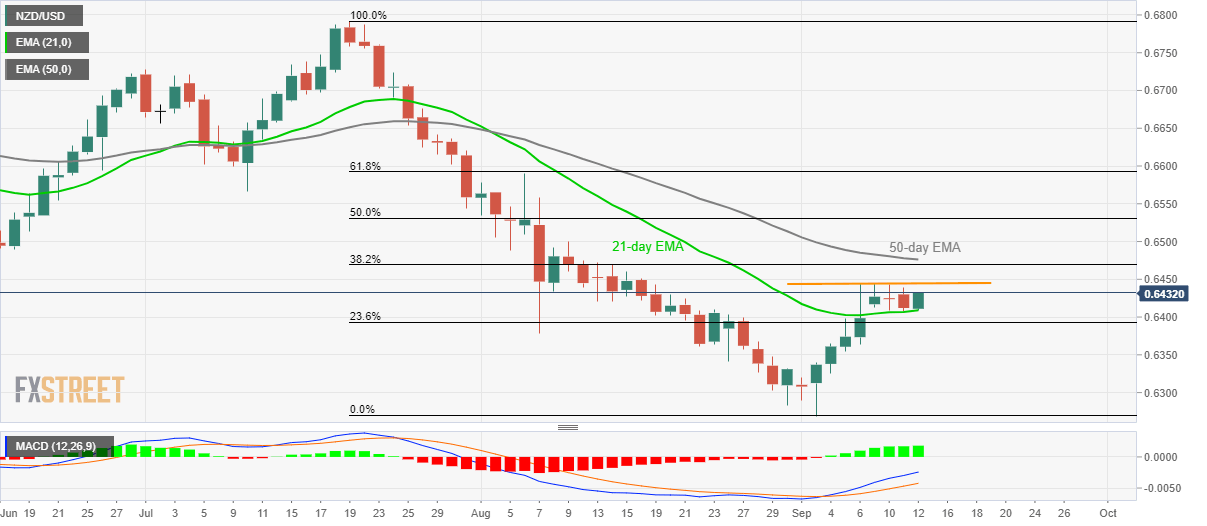
Trend: bullish
