- DXY (US Dollar Index) is on a rollercoaster as the European Central Bank (ECB) cuts rates and launch a Quantitative Easing program.
- The level to beat for bulls is at the 98.68 resistance level.
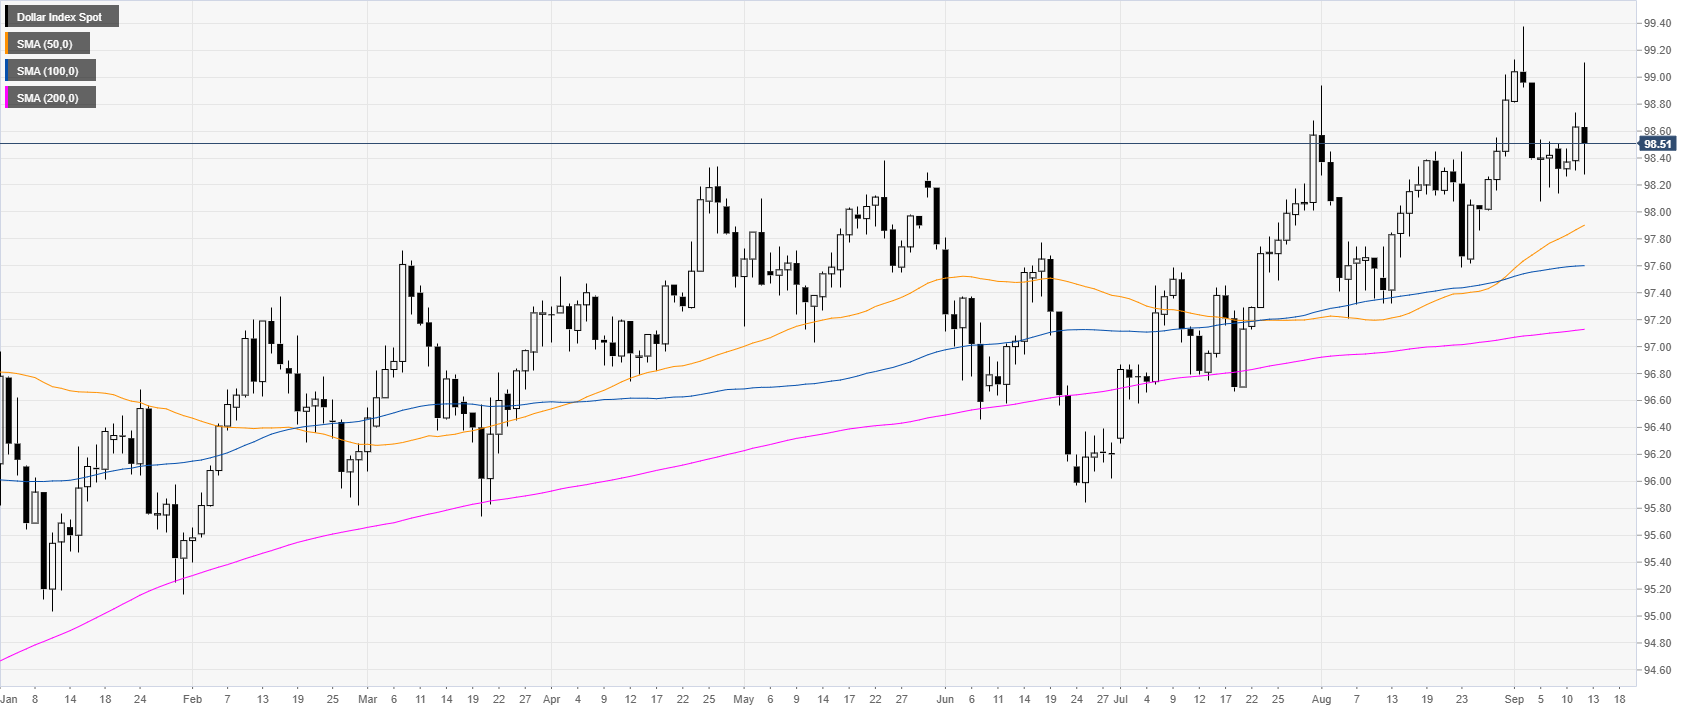
DXY daily chart
DXY (US Dollar Index) is trading in a bull trend above the main daily simple moving averages (DSMAs). The US Dollar Index is on a rollercoaster as the European Central Bank’s decision to slash rates by 10 basis points and launch a new Quantitative Easing program lead to high volatility. The Greenback is also underpinned by rising 10-year US Bond Yields which are trading at 1-month’s high.
DXY four-hour chart
DXY is trading just above rising 100 and 200 SMAs, suggesting bullish momentum in the medium term.
The market is pulling back to the 98.26 and 98.42 support. The main support is at 98.08. If this level is breached, it could put the Greenback under bearish pressure.

DXY 30-minute chart
DXY has reversed the daily gains while now trading below its main SMAs, suggesting bearish momentum in the near term. Bulls will likely have to regain the 98.68 resistance in order to resume the bull trend.

Additional key levels
