- The European Central Bank (ECB) sends markets into turmoil as the Bank cuts rates and launch a Quantitative Easing (QE) program.
- The US Dollar Index (DXY) erases intraday gains and remains bullish above the 200 DSMA.
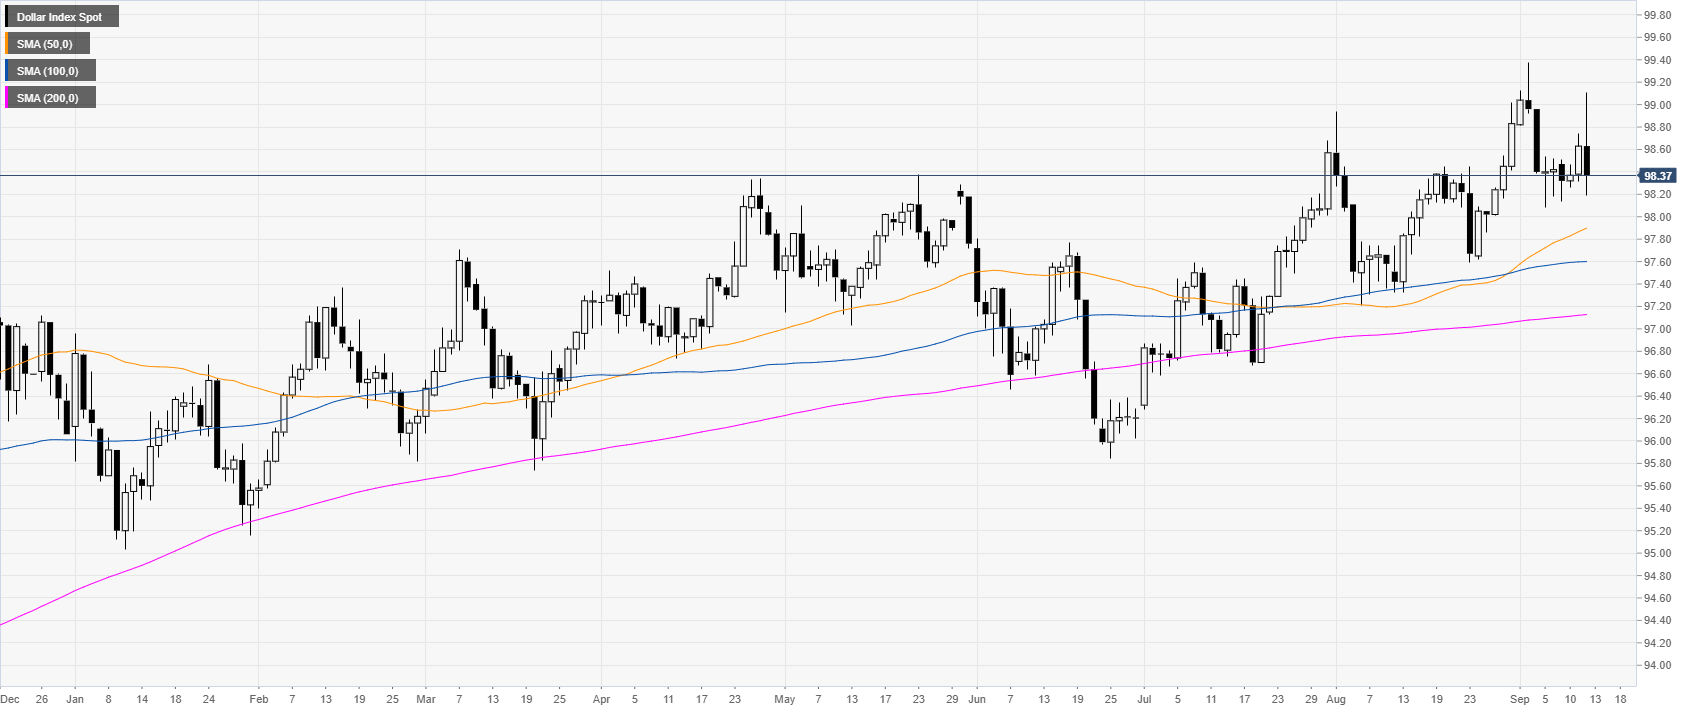
DXY daily chart
DXY (US Dollar Index) is trading in a bull trend above the main daily simple moving averages (DSMAs). The US Dollar Index has been on a rollercoaster this Thursday as the European Central Bank’s cut rates by 10 basis points and launch a new Quantitative Easing program. The Greenback is somewhat underpinned by rising 10-year US Bond Yields which are trading at one-month’s high.
DXY four-hour chart
DXY had a sharp spike down and is now settling above 98.20 and the rising 200 SMA, suggesting bullish momentum in the medium term. Initially, bulls will need to overcome the 98.42 and 98.55 resistances after which 98.68 and 98.94 can come back into play although at this stage it is unclear if the market can get that far in the medium term.

DXY 30-minute chart
DXY erased the earlier intraday gains and is now under pressure below its main SMAs. The 98.20 is for now supporting the market. The 98.08 support level might be the last bastion of defence before a more meaningful correction down in the US Dollar.

Additional key levels
