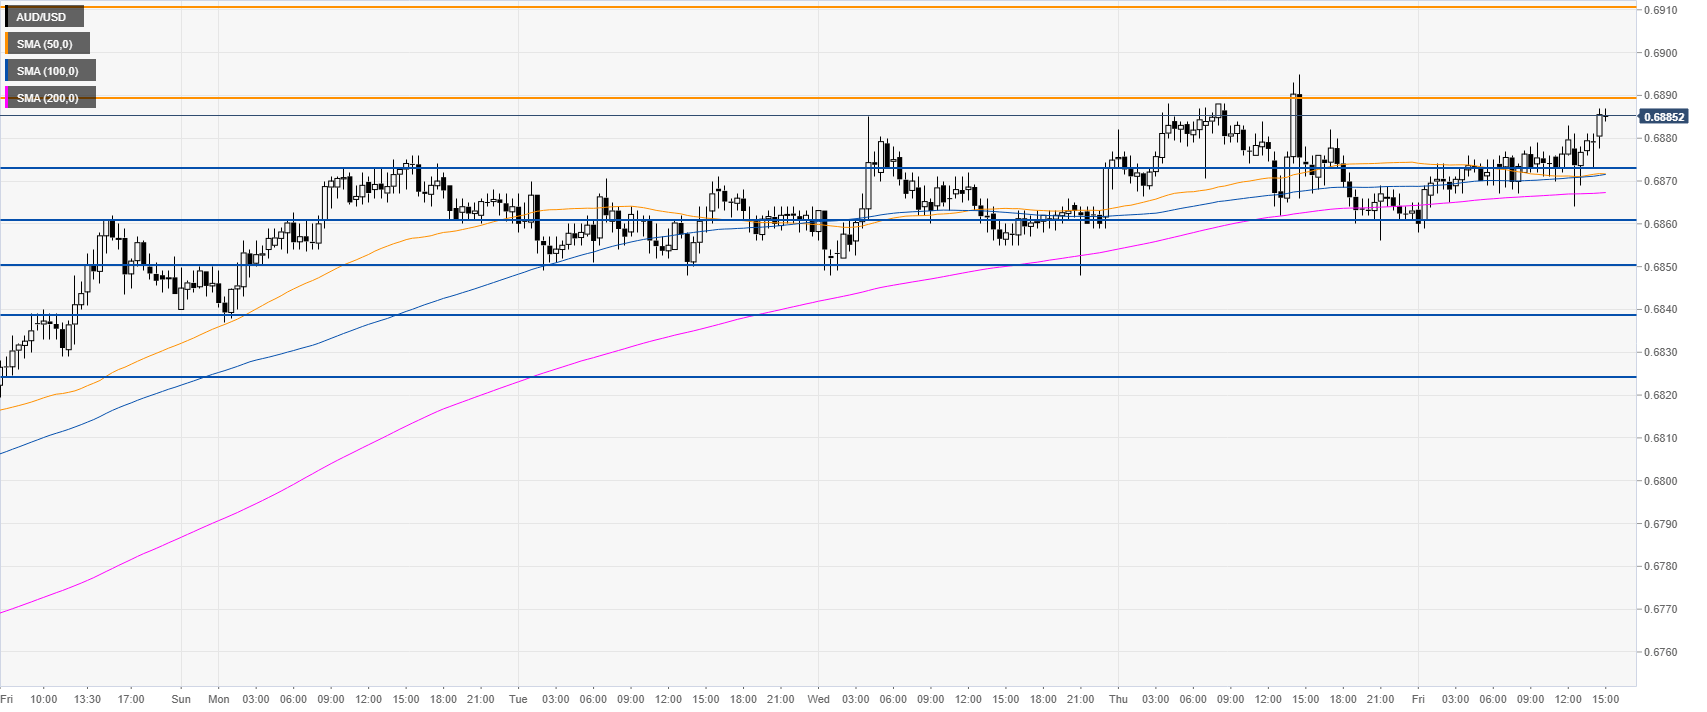
- AUD/USD is grinding up to a fresh daily highs this Friday.
- The level to beat for bulls is the 0.6890 level.
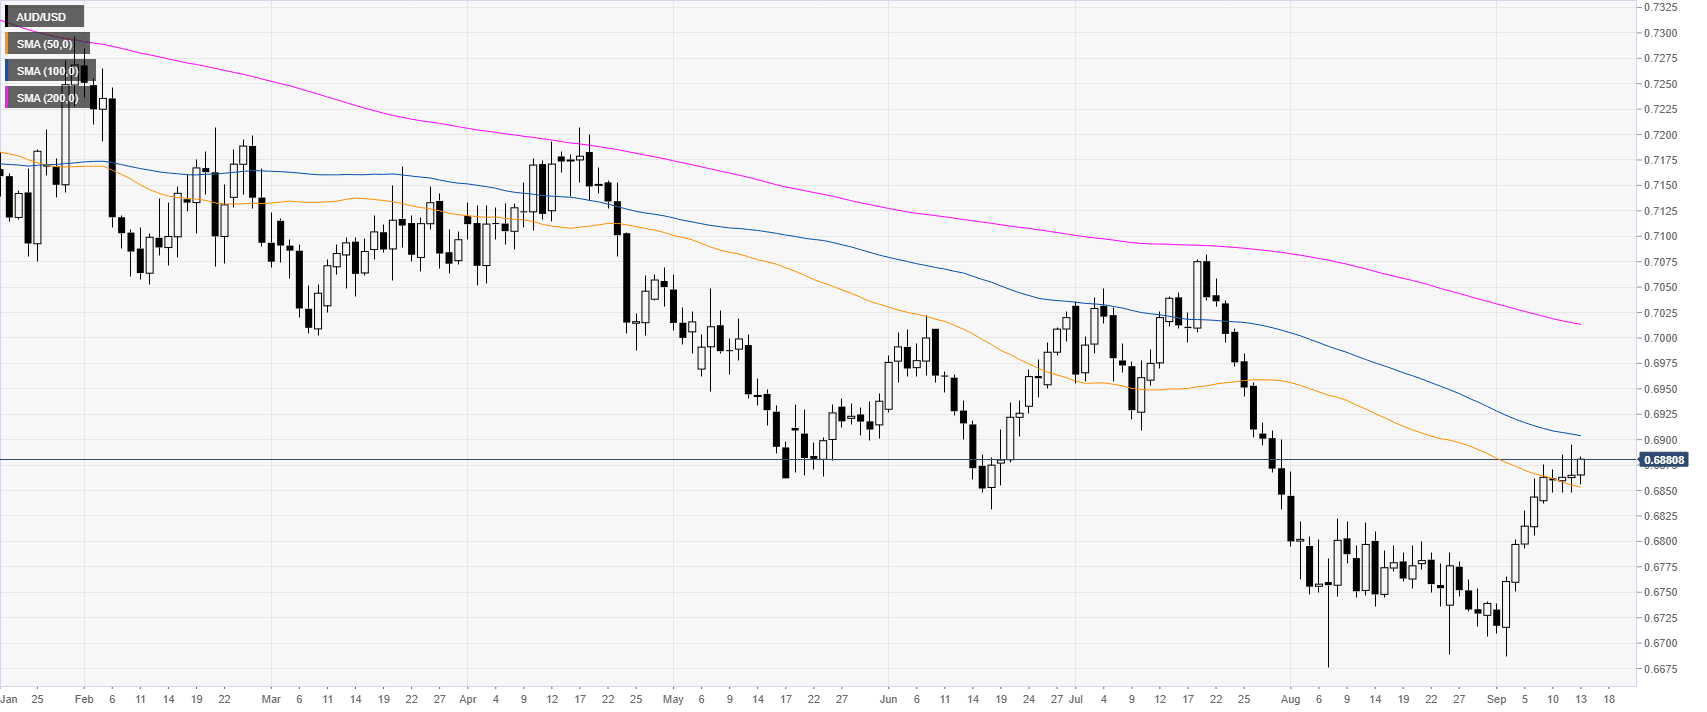
AUD/USD daily chart
AUD/USD is trading in a bear trend below the 100 and 200-day simple moving averages (SMAs). However, in August and September, the market has been rebounding sharply.
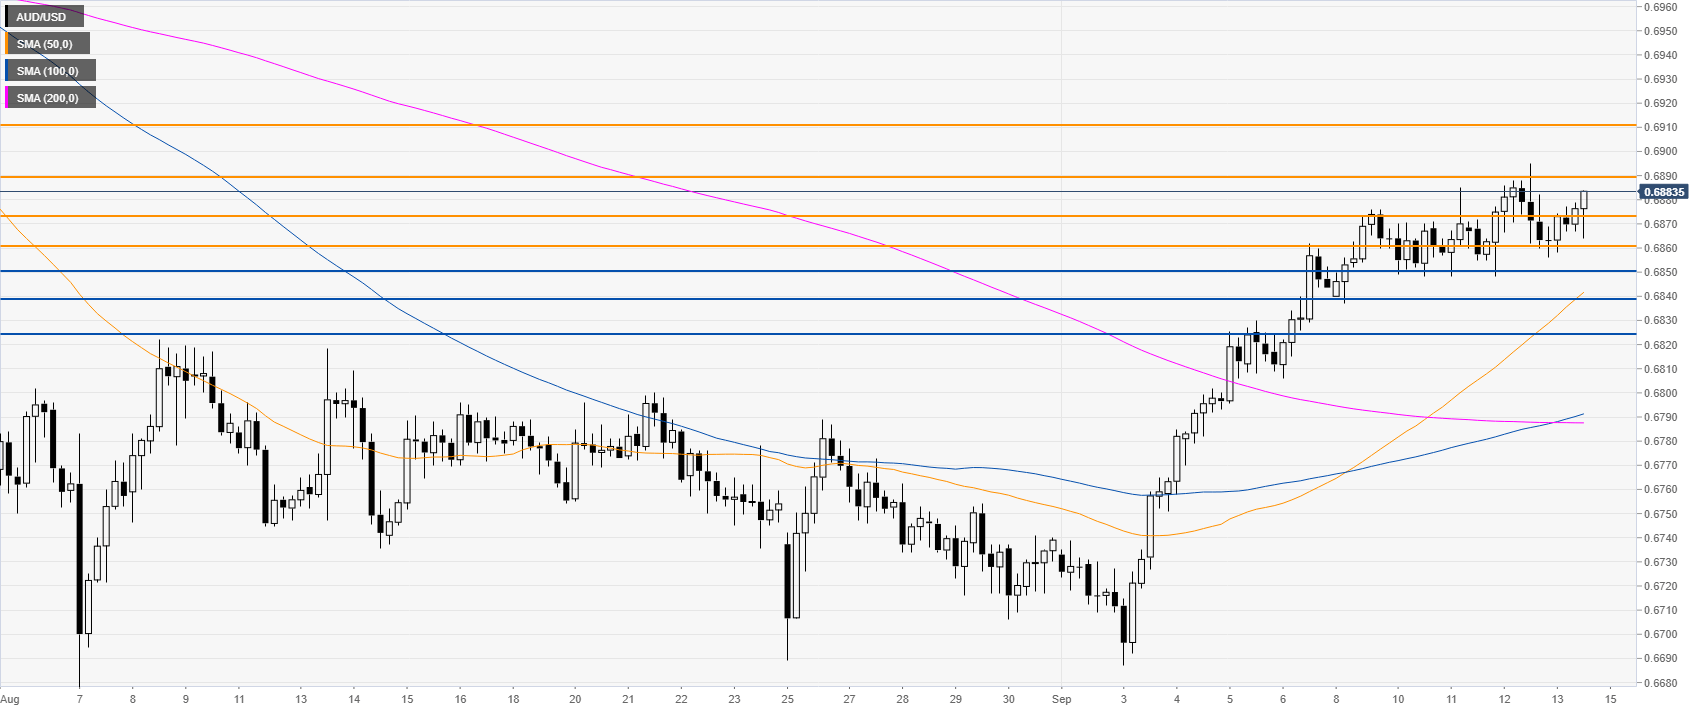
AUD/USD 4-hour chart
The Aussie is trading above its main simple moving averages (SMAs), suggesting bullish momentum in the near term. The market made little progress this week and bulls will need to surpass the 0.6890 resistance if they want to extend the bull run. Further up lie the 0.6910 resistance level, according to the Technical Confluences Indicator.
AUD/USD 30-minute chart
AUD/USD is grinding to the daily highs and approaching the 0.6890 resistance. Immediate support is seen at 0.6873, 0.6860 and 0.6850, according to the Technical Confluences Indicator.
Additional key levels
