- EUR/USD is challenging a critical resistance level near 1.1107.
- The Retail Sales Control Group came in line with expectations at 0.3%, resulting in an embryonic uptick in USD.
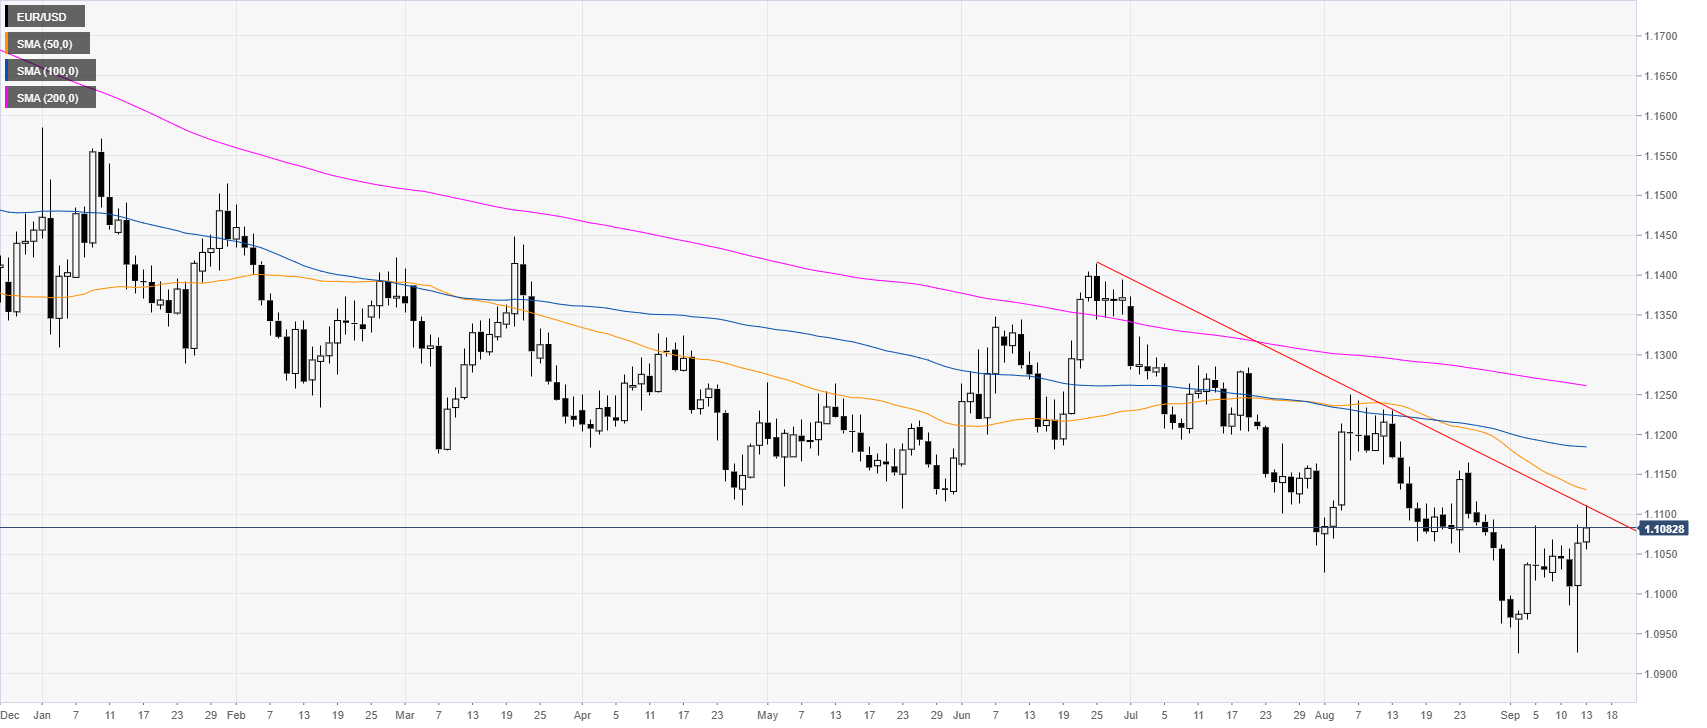
EUR/USD daily chart
On the daily time-frame, the common currency is trading in a bear trend below the main daily simple moving averages (DSMAs). On Thursday, the European Central Bank’s (ECB) cut interest rates by 0.1% and announced an open-ended Quantitive Easing (QE). However, the market deemed that the ECB was not dovish enough and the EUR rose. This Friday the Retail Sales Control Group in the United States (US) came in line with expectations at 0.3% in August.
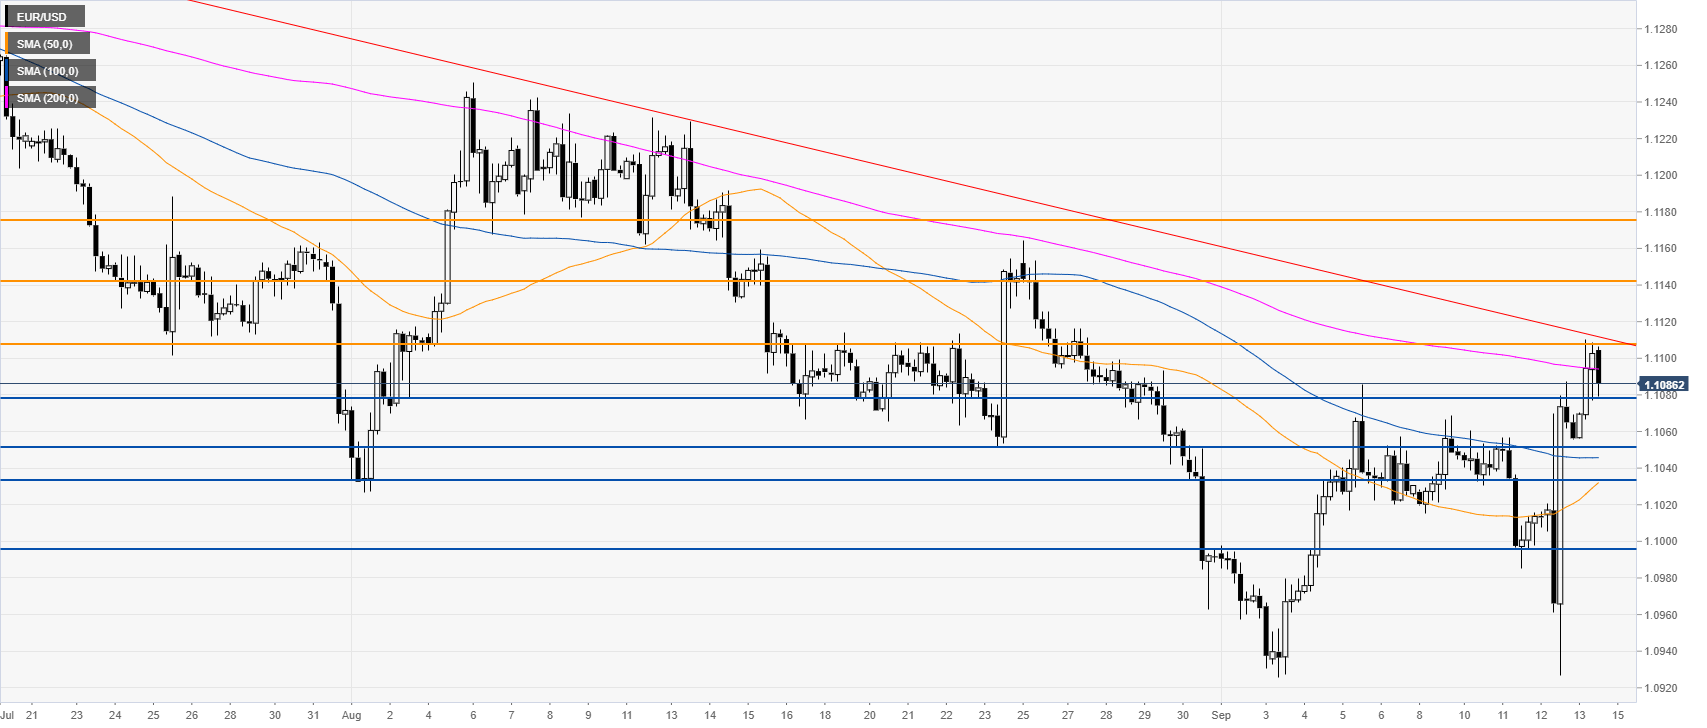
EUR/USD four-hour chart
The Fiber is challenging a key resistance zone comprised of a multi-week descending trendline, the 200 SMA, and the 1.1107 resistance level. If the bulls manage to break above this level, it can lead to an acceleration of the current bull move towards the 1.1142 and 1.1176 price levels, according to the Technical Confluences Indicator.
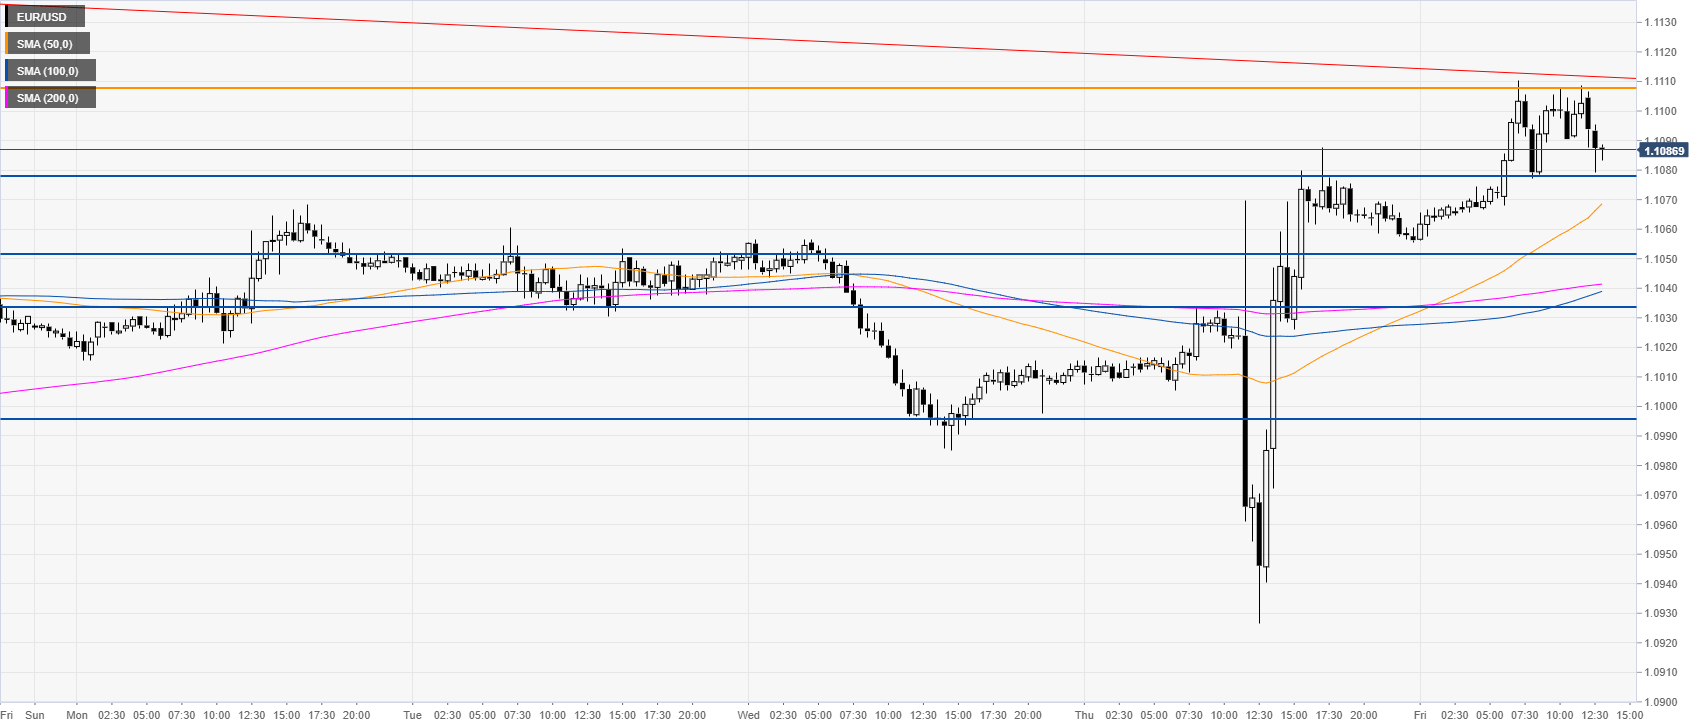
EUR/USD 30-minute chart
The market is off the daily highs as the market is looking for the next directional move. The bears would need to trade below the 1.1079 support to drive the market towards 1.1050, 1.1033 and 1.0992 on the way down, according to the Technical Confluences Indicator.
Additional key levels
