- GBP/USD seesaws around 1.2330.
- A downside break of 50-DMA can recall early-August lows while 100-DMA could question buyers beyond 1.2385.
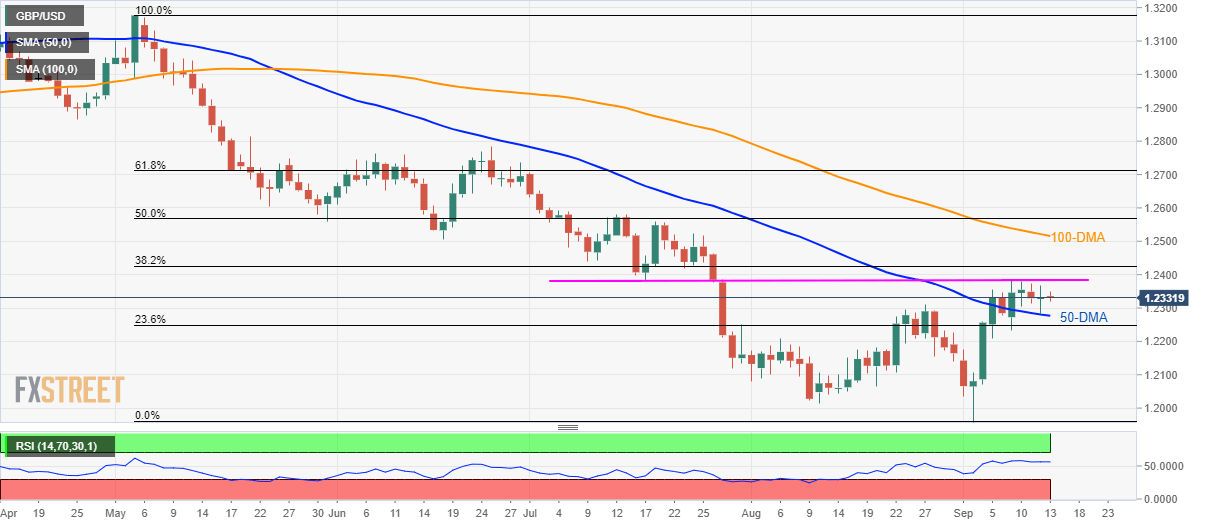
GBP/USD holds the title of least volatile major currency pair as it trades near 1.2330 during the Asian session on Friday.
The pair has been choppy off-late with 50-day simple moving average (DMA) limiting the quote’s downside around 1.2275 while the advances seem capped by a horizontal area including July 17 low and current week high, near 1.2380/85.
However, above 50 levels of 14-bar relative strength index (RSI) favor buyers who can target the 100-DMA level of 1.2515 on the successful break of 1.2385.
Additionally, 50% Fibonacci retracement level of May-September declines, at 1.2570, and 61.8% Fibonacci retracement near 1.2710 could please the bulls past-1.2515.
Alternatively, pair’s daily closing below 50-DMA level of 1.2275 can fetch the quote to an early-August high near 1.2210 whereas 1.2100 and 1.2015 could act as an intermediate halt during the pair’s further declines targeting 1.2000 round-figure.
GBP/USD daily chart
Trend: sideways
