- USD/CNH drops the lowest since August 19.
- 50-day EMA could restrict further declines ahead of highlighting five-month-old rising trend-line.
Following its sustained trading below the 21-day exponential moving average (EMA), USD/CNH plummets to the lowest since mid-August as it trades near 7.050 while heading into the European session on Friday.
50-day EMA level of 7.0417 acts as immediate strong support for the pair, breaking which 38.2% Fibonacci retracement of April-September rise, at 7.000, could question sellers, if not then a rising trend-line since mid-April around 6.9665 will be the key to watch.
Alternatively, 7.0850 can limit the pair’s advances to 21-day EMA level of 7.0996 while 7.1400 and latest high surrounding 7.1970 might entertain bulls then after.
It should also be noted that pair’s north-run beyond 7.1970, can easily overcome 7.2000 round-figure.
USD/CNH daily chart
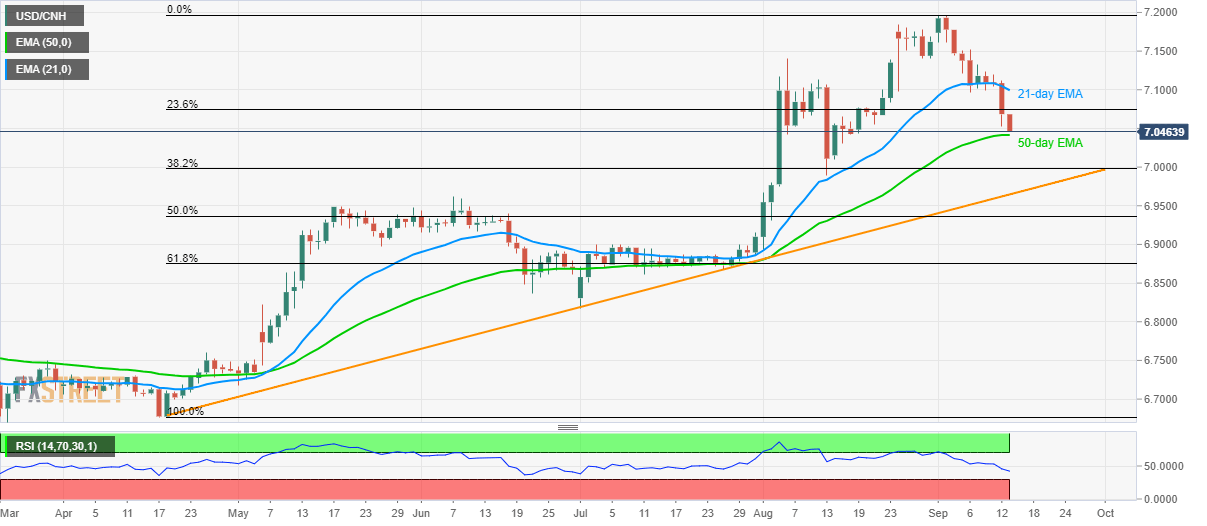
Trend: pullback expected
