- USD/IDR bounces off July lows but remains below 23.6% Fibonacci retracement.
- 21-day EMA, 38.2% Fibonacci retracement confluences becomes short-term key resistance.
Even after bouncing off July month bottom, the USD/IDR pair fails to successfully cross 23.6% Fibonacci retracement of April-June downpour as it trades near 13,920 during the Asian session on Friday.
While oversold conditions of 14-day relative strength index (RSI) questions that pair’s further declines below July month low surrounding 13,880, an extended south-run might not hesitate to visit yearly bottom surrounding 13,750.
On the upside, pair’s sustained rise beyond 23.6% Fibonacci retracement level around 13,980 offers immediate resistance, a break of which can propel prices to Tuesday’s low near 14,070.
However, 21-day exponential moving average (EMA) and 38.2% Fibonacci retracement, at 14,110/15, could restrict pair’s advances past-14,070, if not then a run-up towards monthly top surrounding 14,275 can’t be denied.
USD/IDR daily chart
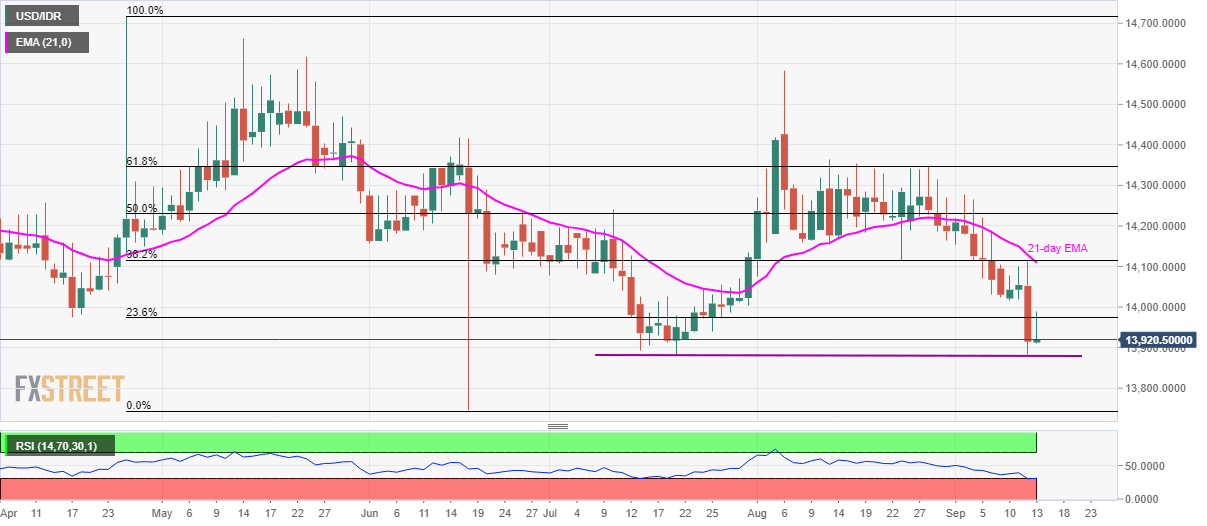
Trend: pullback expected
