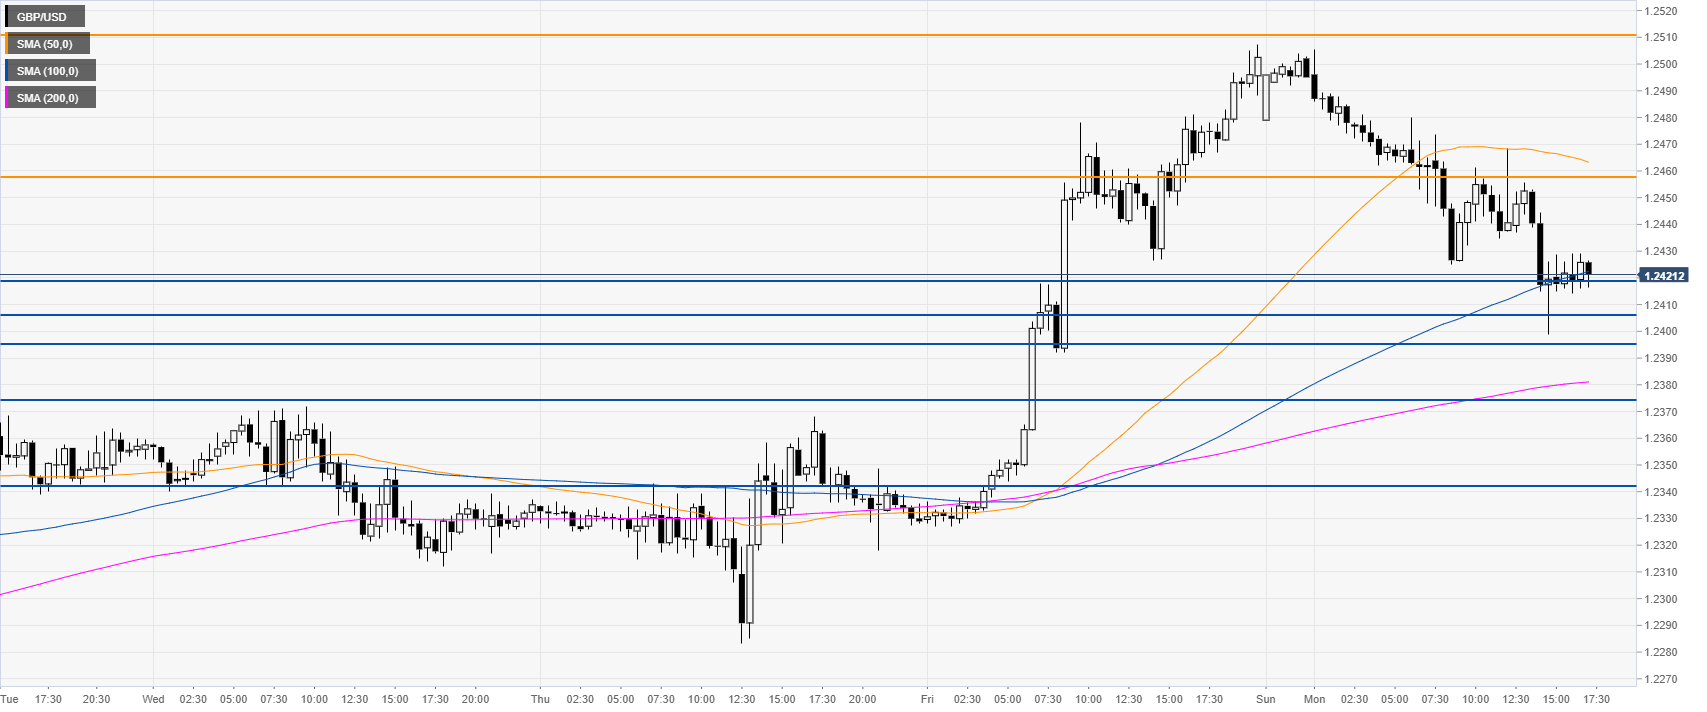
- The Sterling has been in correction mode this Monday.
- The level to beat for sellers is the 1.2420/07 support zone.
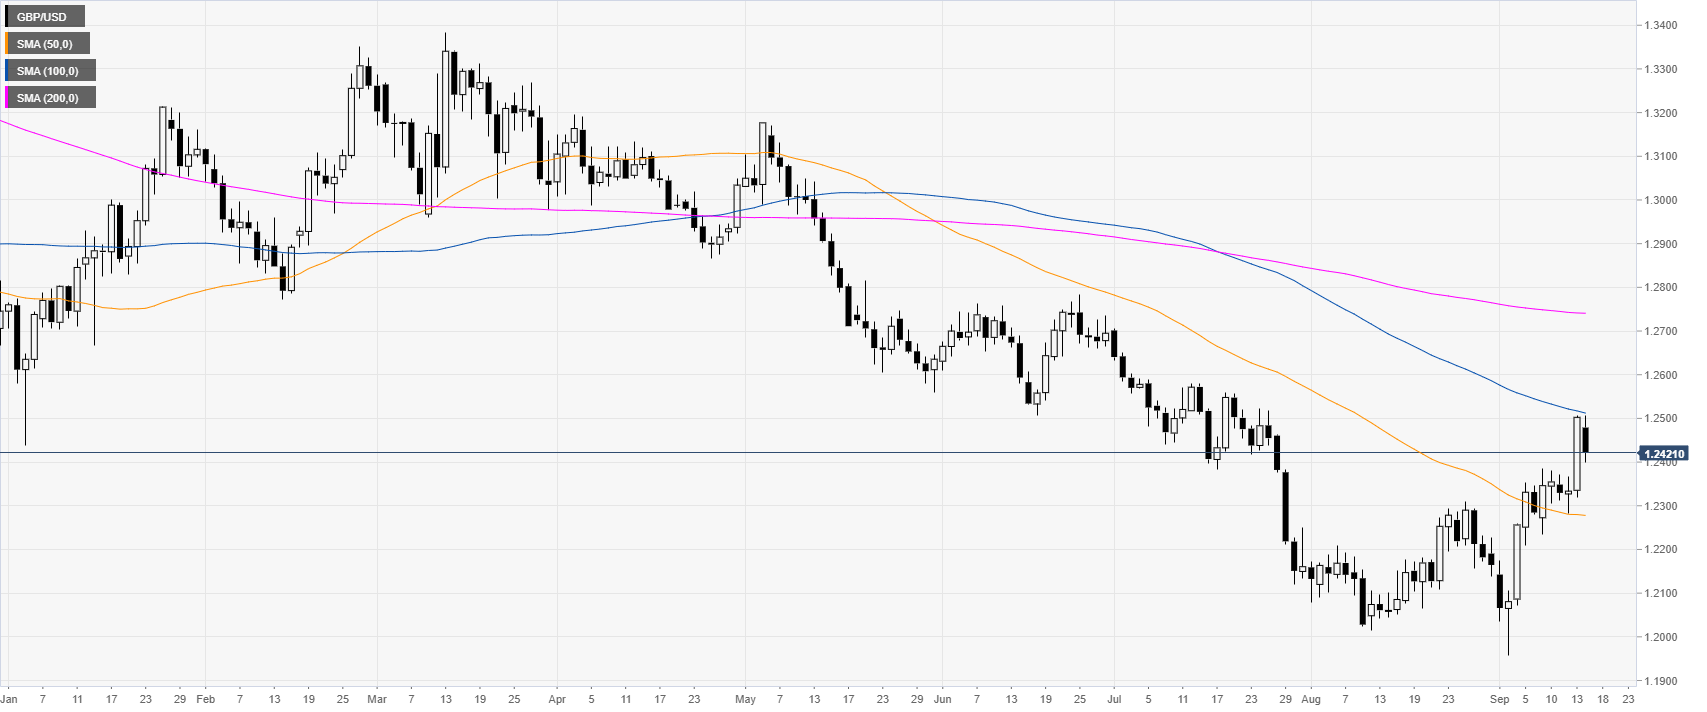
GBP/USD daily chart
The Sterling is in a bear trend below the 100 and 200-day simple moving averages (SMAs). However, in September, the market has been rebounding sharply to the 1.2500 handle.
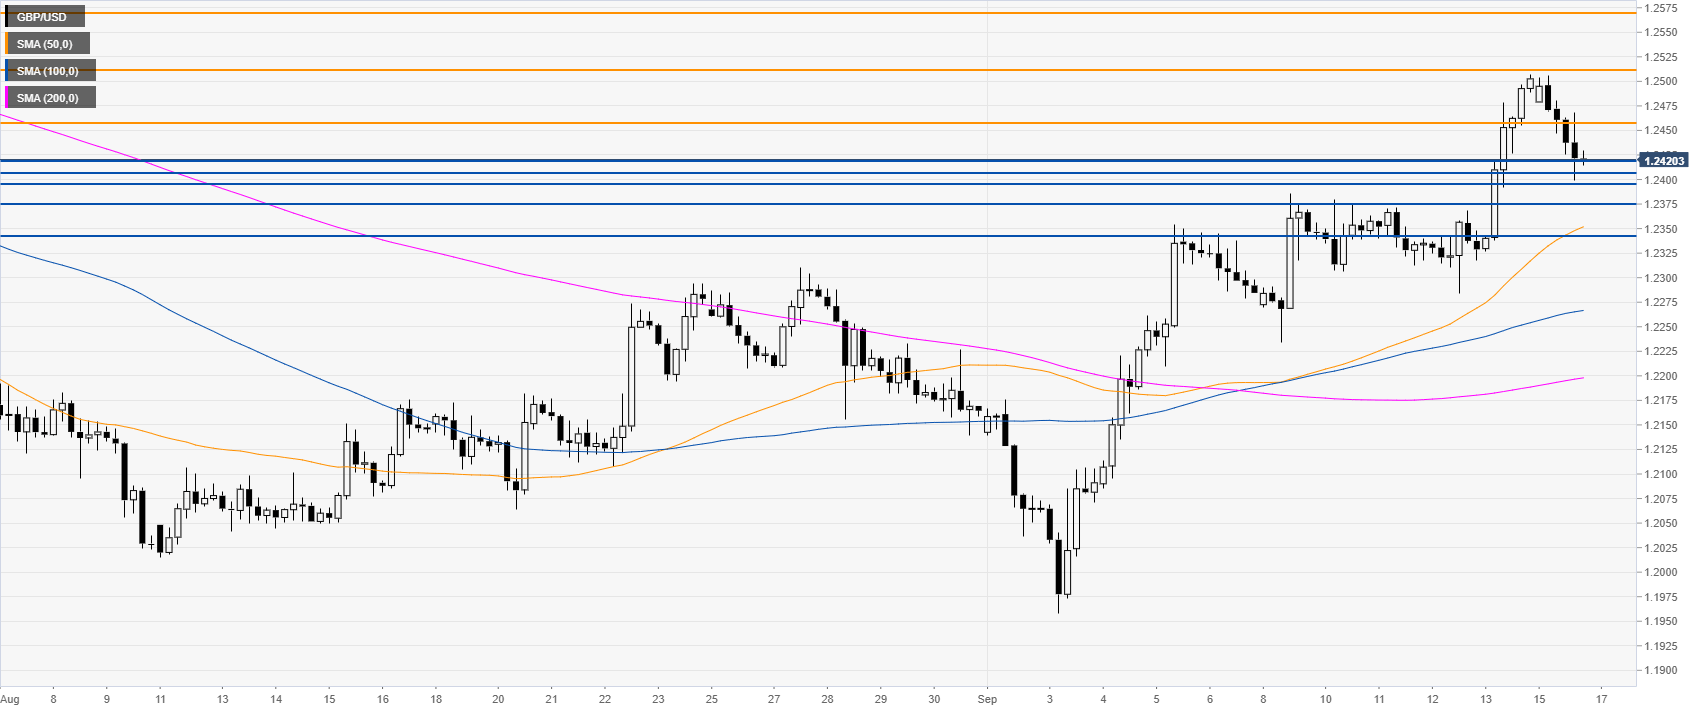
GBP/USD four-hour chart
The Pound is trading above the main SMAs as the market ran to the 1.2507 price level last Friday. Buyers will need to reclaim this level if they want to target 1.2510 and 1.2570 to the upside, according to the Technical Confluences Indicator.
GBP/USD 30-minute chart
The Sterling is in consolidation mode near the 1.2420 support and the 100 SMA. The market is likely going to continue correcting lower, but sellers have strong levels of support to go through. On the way down, 1.2420/07 and 1.2394 is a tough nut to crack. After which comes the 1.2342 price level, into last week’s range, according to the Technical Confluences Indicator.
Additional key levels
