- The Sterling is trading on the back foot since the open in Asia.
- The level to beat for bears is the 1.2420/07 support zone.
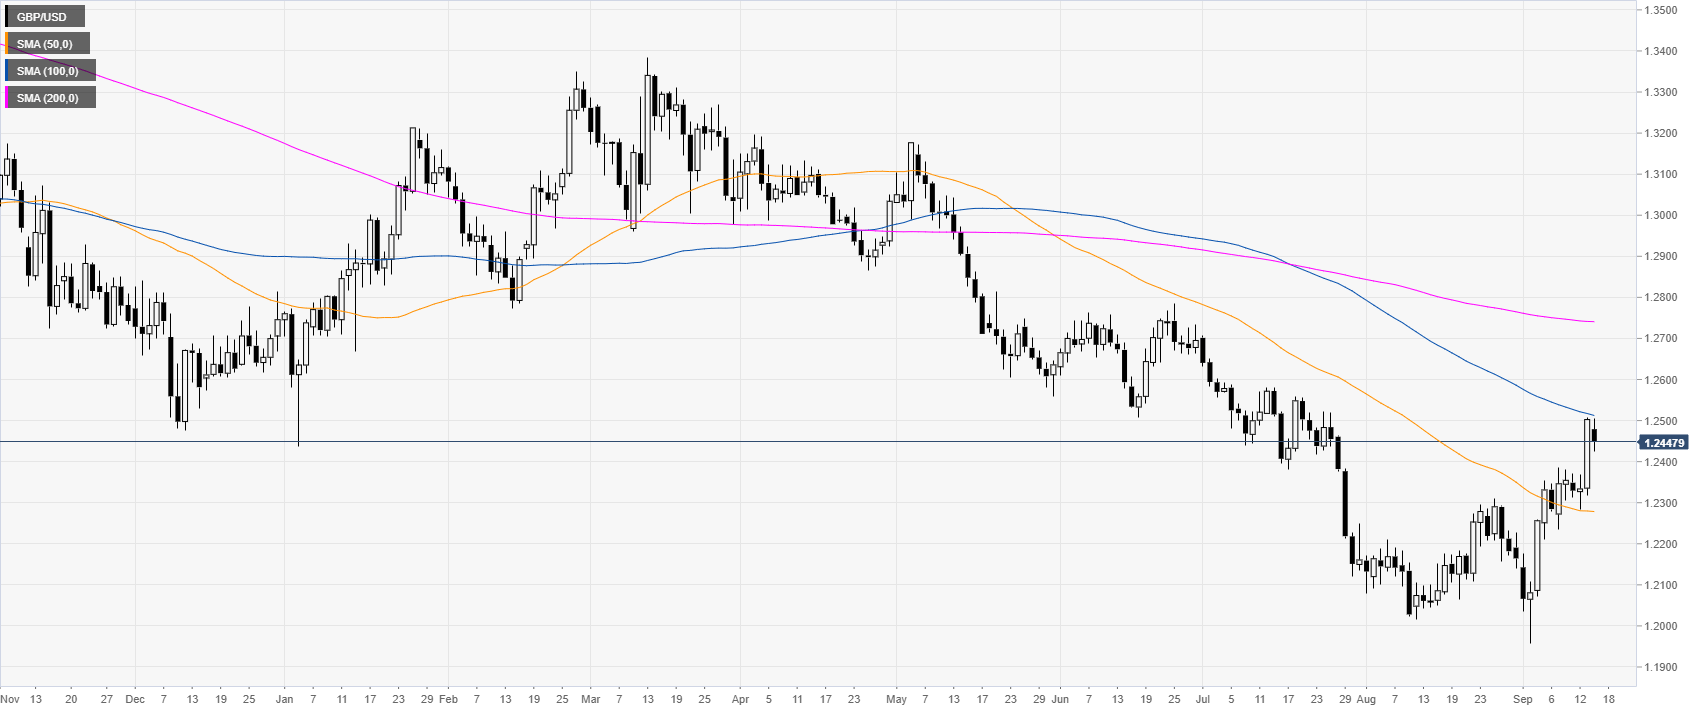
GBP/USD daily chart
The Pound is trading in a bear trend below the 100 and 200-day simple moving averages (SMAs). However, the price action in September has been virtually one-sided with buyers taking the helm.
GBP/USD four-hour chart
The Sterling is trading well above the main SMAs as the market spiked up to the 1.2507 price level. This id the level to beat if bulls want to reach 1.2510 and 1.2570 to the upside, according to the Technical Confluences Indicator.

GBP/USD 30-minute chart
The Sterling is consolidating the Friday’spike below the 1.2420 resistance and the 50 SMA. The market is seen correcting lower. However, sellers have tough levels of support to go through. On the way down, 1.2420/07 and 1.2394 forms a thick layer of support which is followed by 1.2342, which is into last week’s range, according to the Technical Confluences Indicator.

Additional key levels
