- The Greenback is rising from last week lows as the bulls are breaking through many layers of resistance.
- Investors will pay close attention to the FOMC on Wednesday.
- The level to beat for buyers is the 98.68 and 98.10 resistance levels.
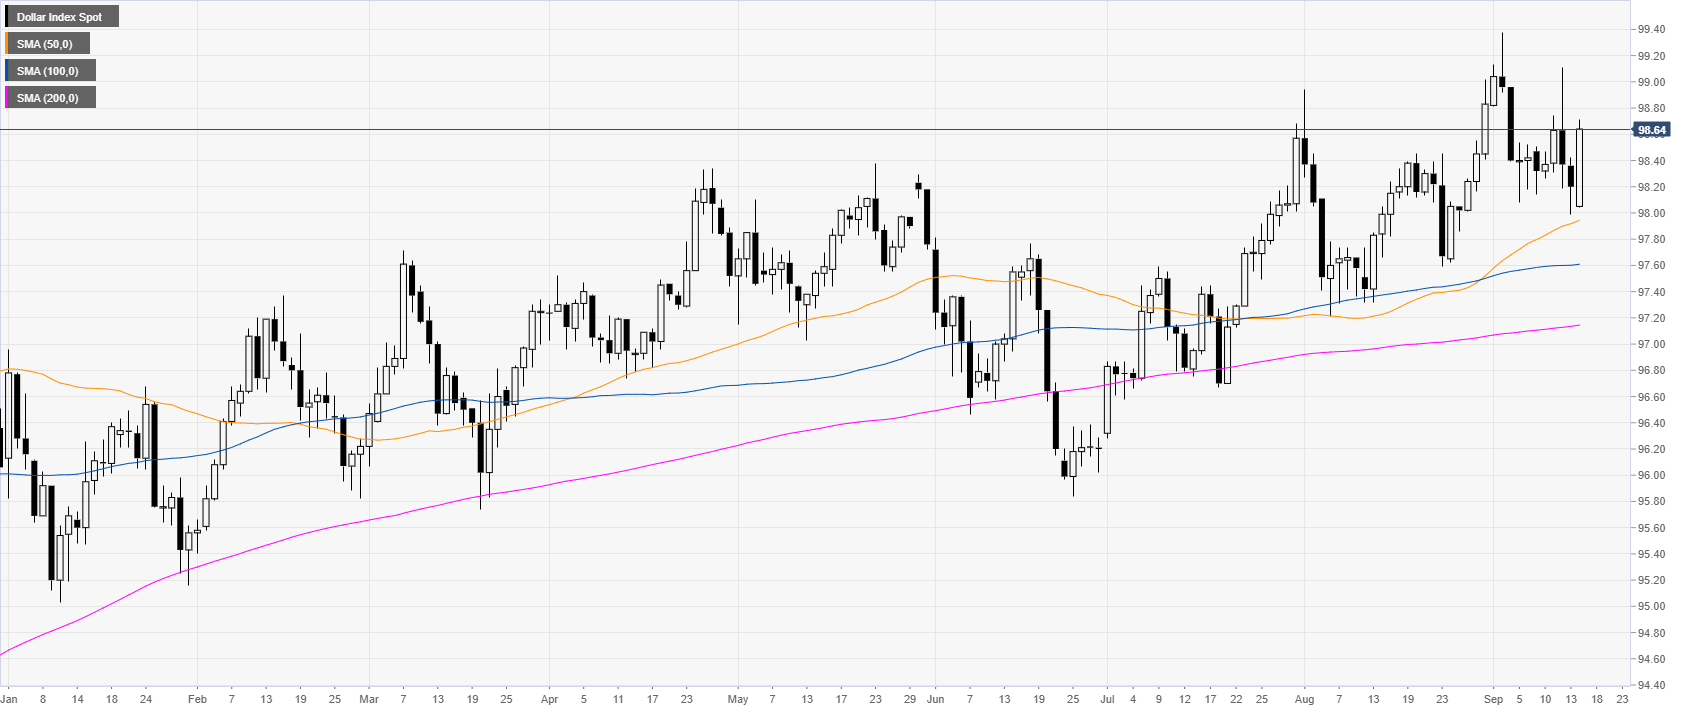
DXY daily chart
DXY (US Dollar Index) is in a bull trend above its main daily simple moving averages (DSMAs). DXY is gaining some momentum in a risk-off environment. Investors will closely be monitoring the FOMC on Wednesday.
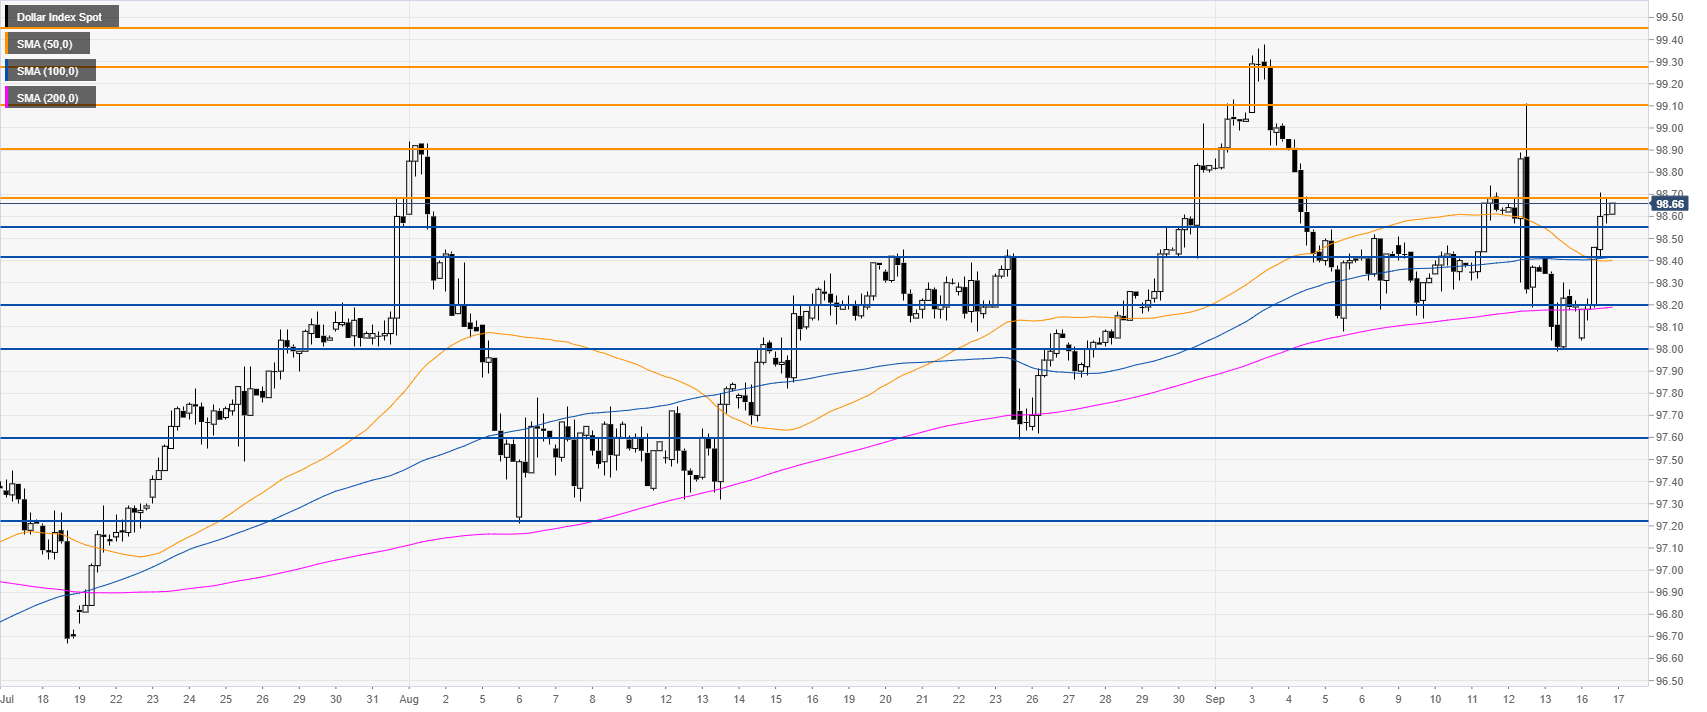
DXY four-hour chart
DXY is trading above the main SMAs, suggesting a bullish bias in the medium term. Bulls broke through several levels of resistance at the 98.42 and 98.55 price levels. The market is now challenging the 98.68 level which, if broken, can open the doors to the 99.10 key resistance.
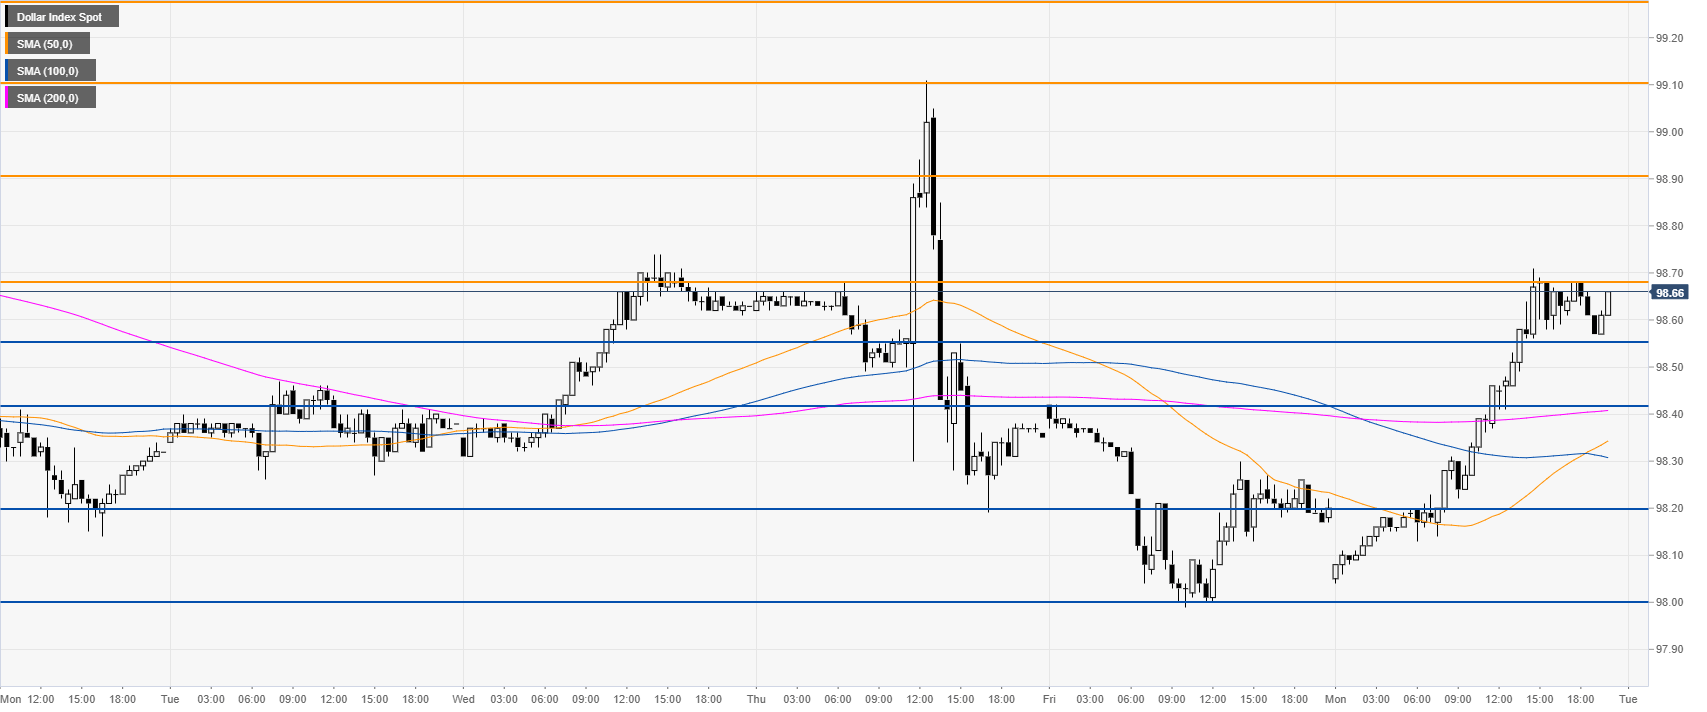
DXY 30-minute chart
DXY is trading above the main SMAs, suggesting a bullish momentum in the near term. Immediate support can be found at the 99.55 and 98.42 price levels.
Additional key levels
