- EUR/USD is pressuring the daily highs as the market is nearing the 1.1072 resistance.
- Investors are awaiting the FOMC at 18:00 GMT for potential fresh directional clues.
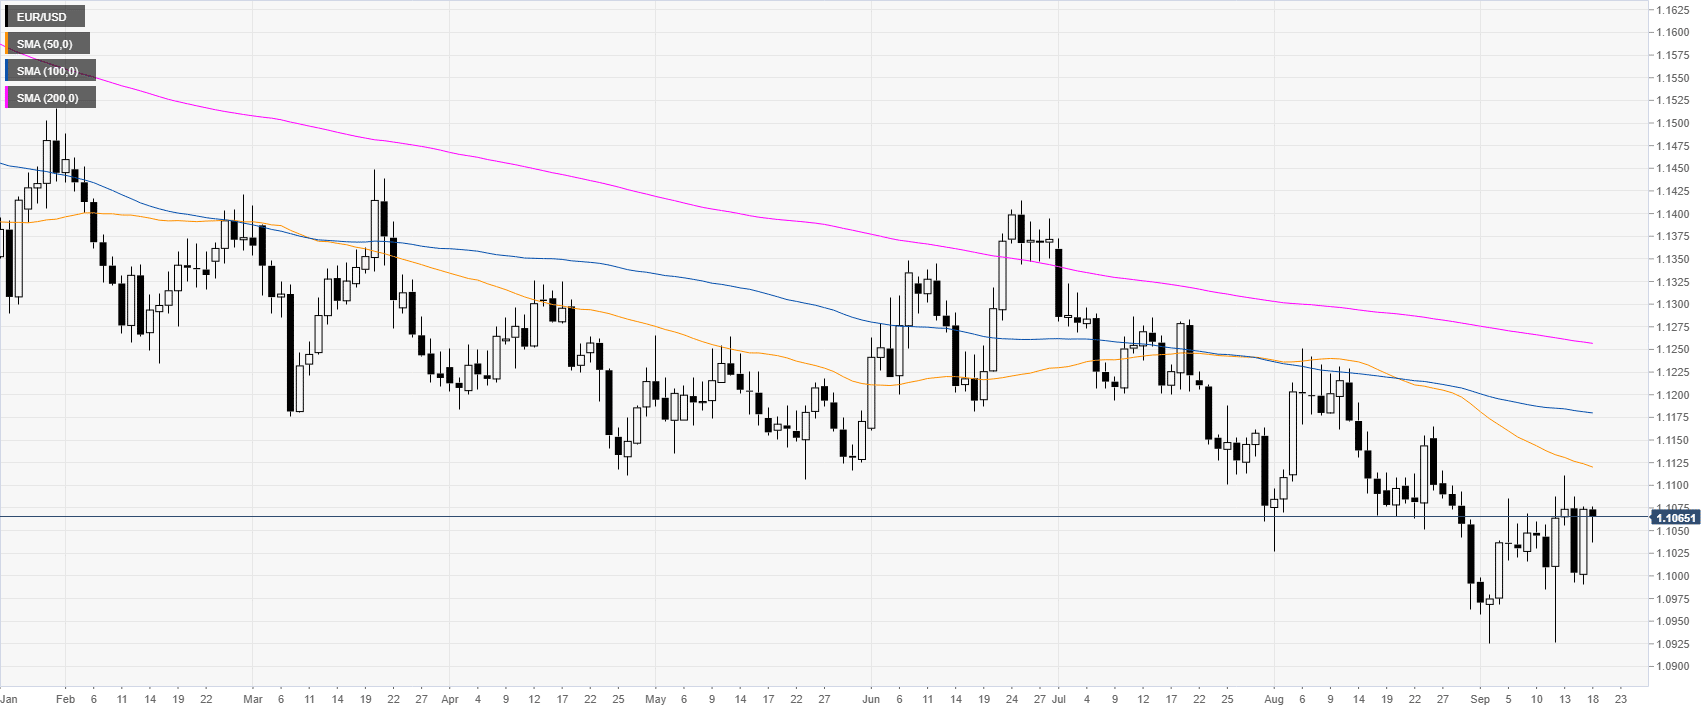
EUR/USD daily chart
The common currency, on the daily chart, is trading in a bear trend below its main daily simple moving averages (DSMAs). Investors will monitor the FOMC this Wednesday as market participants have already priced in a 25bps rate cut.
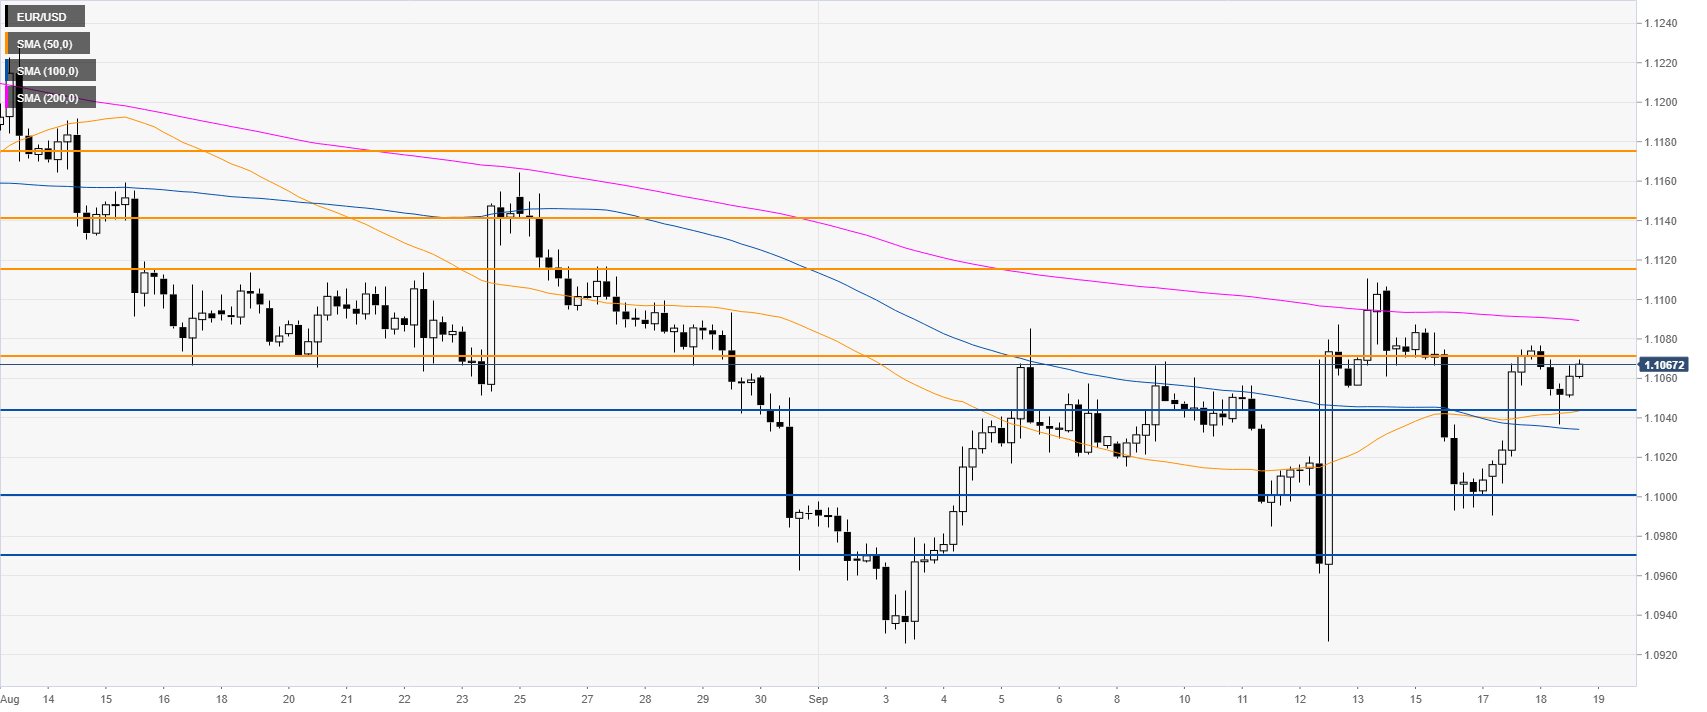
EUR/USD four-hour chart
EUR/USD is trading between the 100 and 200 SMA, suggesting a sideways market in the medium term. The market is likely waiting for the FOMC before committing to the bullish or bearish side. If the market breaks the 1.1073 and 1.1118 resistances, EUR/USD can accelerate towards 1.1141 and 1.1176 price levels, according to the Technical Confluences Indicator.
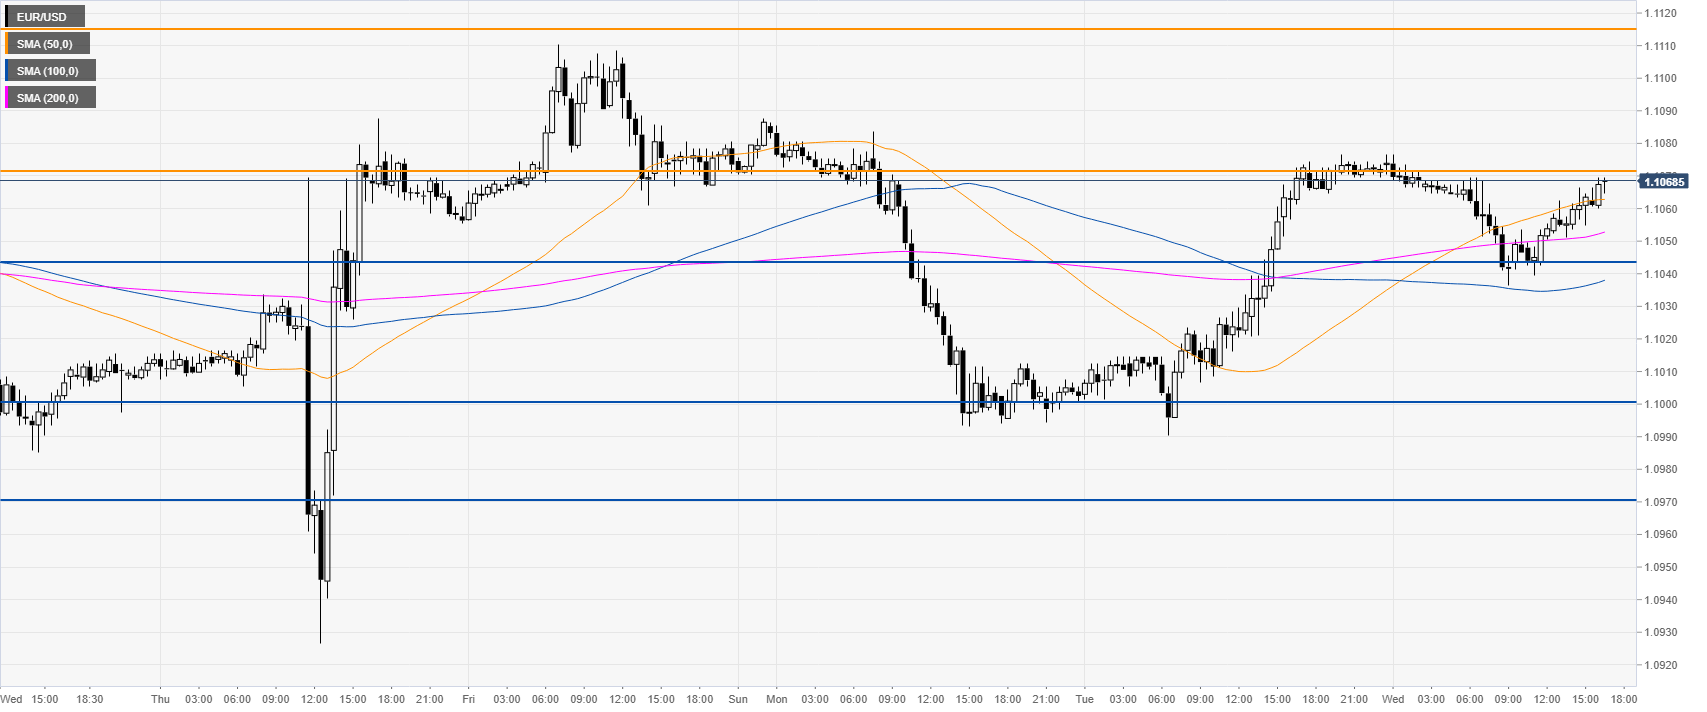
EUR/USD 30-minute chart
EUR/USD is grinding up above the main SMAs nearing the 1.1072 resistance. The market is mildly bullish ahead of the FOMC. Immediate support is at the 1.1044 level. Further down lie the 1.1000 support followed by the 1.0970 price level, according to the Technical Confluences Indicator.
Additional key levels
