- GBP/USD refrains from extending Tuesday’s run-up amid overbought RSI.
- 23.6% Fibonacci retracement and 200-hour EMA can question sellers.
The GBP/USD pair’s run-up to two-month high failed to prevail for long as the quote declines to 1.2490 ahead of the UK session open on Wednesday.
While showing the momentum, 14-bar relative strength index (RSI) flashes overbought signals, which in turn indicate brighter chances of pair’s further declines to 23.6% Fibonacci retracement level of current month upside, at 1.2393.
The 200-hour exponential moving average (EMA), at 1.2376 now, acts as strong downside support below 1.2393, which if ignored could recall 50% Fibonacci retracement area around 1.2230.
Alternatively, recent highs close to 1.2530 and a two-week-old rising trend-line near 1.2565 could please buyers during further advances.
GBP/USD hourly chart
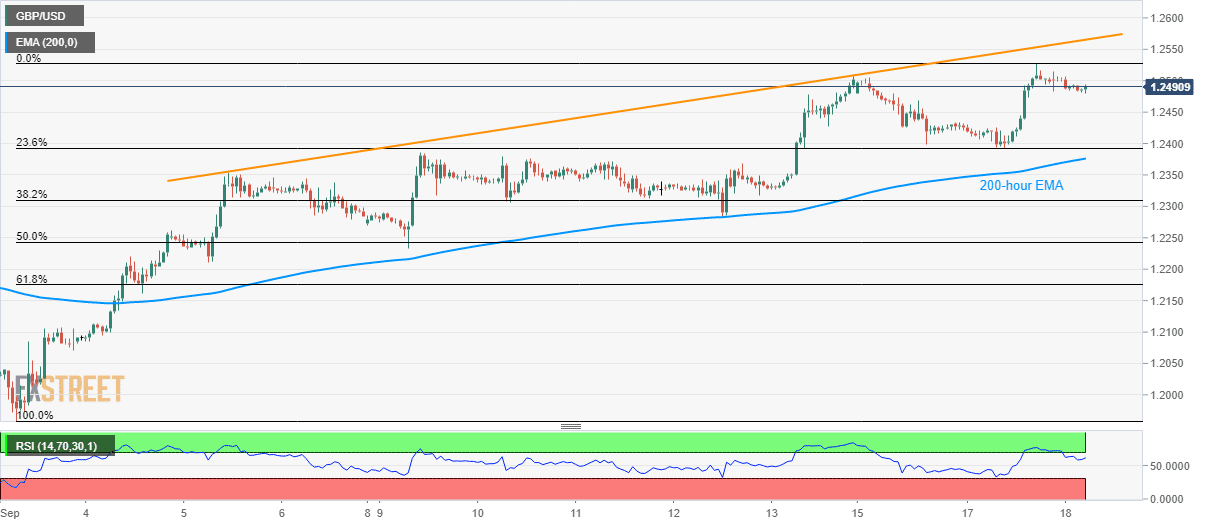
Trend: pullback expected
