- NZD/USD follows three-day-old falling trend-line, slips below 61.8% Fibonacci retracement.
- Early-month high, Tuesday’s low could offer intermediate halt during the declines.
With its sustained follow-up of a downward sloping trend-line since Friday, NZD/USD slips below 61.8% Fibonacci retracement of current month upside as it trades near 0.6336 on early Wednesday.
Considering likely bearish signal from the 12-bar moving average convergence and divergence (MACD) indicator, the pair declines towards 0.6320 horizontal-line comprising early-month highs and Tuesday’s low.
Should there be additional weakness below 0.6320, 0.6300 and monthly bottom surrounding 0.6270 will become sellers’ favorites.
On the contrary, pair’s break of immediate resistance-line, at 0.6360 now, could trigger fresh advances to 200-hour exponential moving average (EMA) level close to 0.6380.
If at all the quote remains positive above 0.6380, 0.6400, 23.6% Fibonacci retracement level of 0.6410 and 0.6450 will be on buyers’ radar.
NZD/USD hourly chart
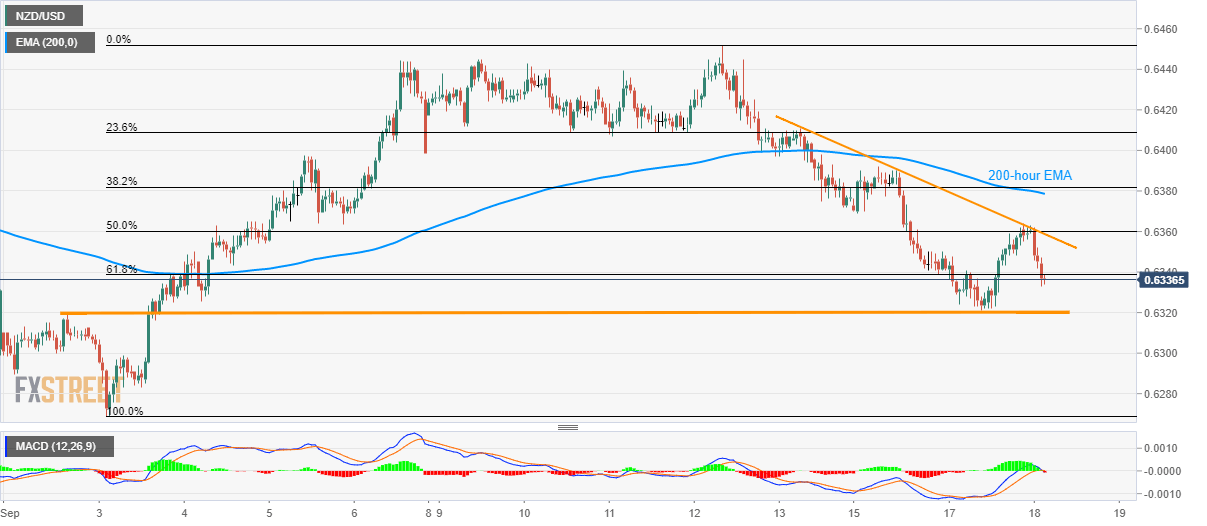
Trend: bearish
