- The Sterling is rising sharply after the London close.
- The level to beat for buyers is the 1.2554 price level.
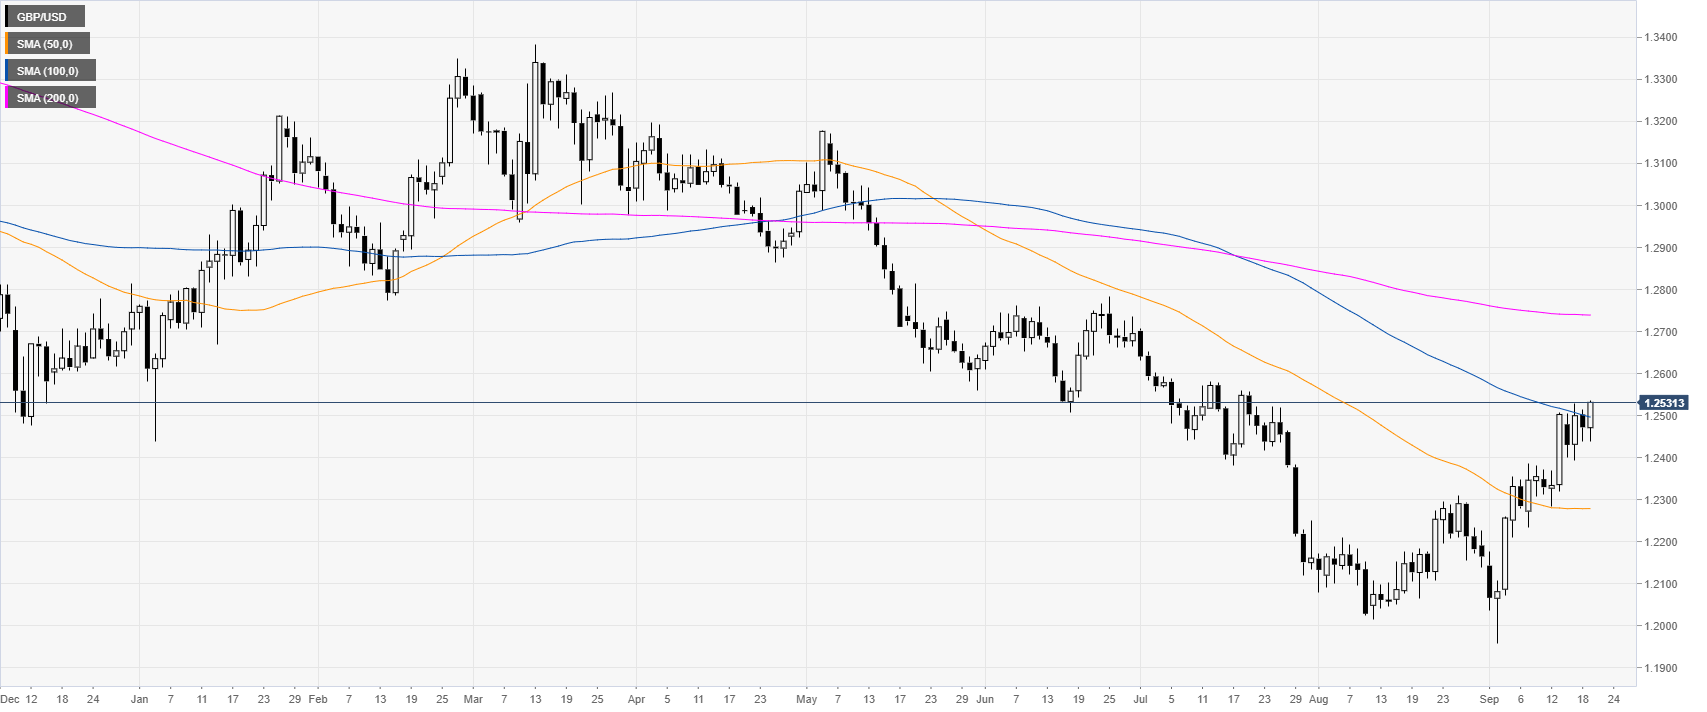
GBP/USD daily chart
The Sterling is trading in a bear trend below the 200-day simple moving averages (SMAs). However, GBP/USD has been rising sharply in Septembre. It is now challenging the 1.2500 figure.
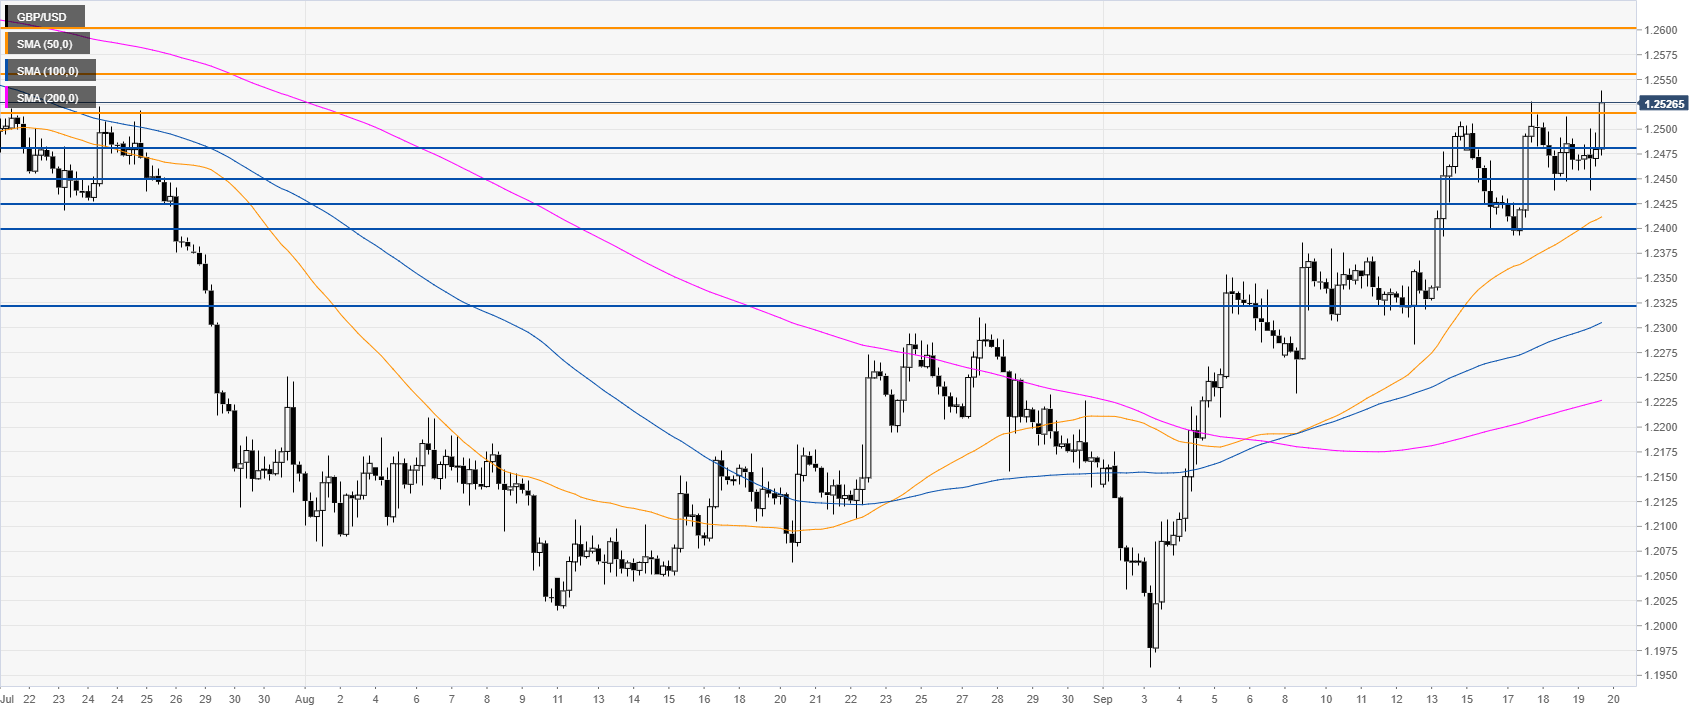
GBP/USD four-hour chart
GBP/USD is trading above the main SMAs, suggesting a bullish bias in the medium term. The market is challenging the 1.2515 resistance as bulls want to continue the up move towards the 1.2554 resistance, according to the Technical Confluences Indicator.
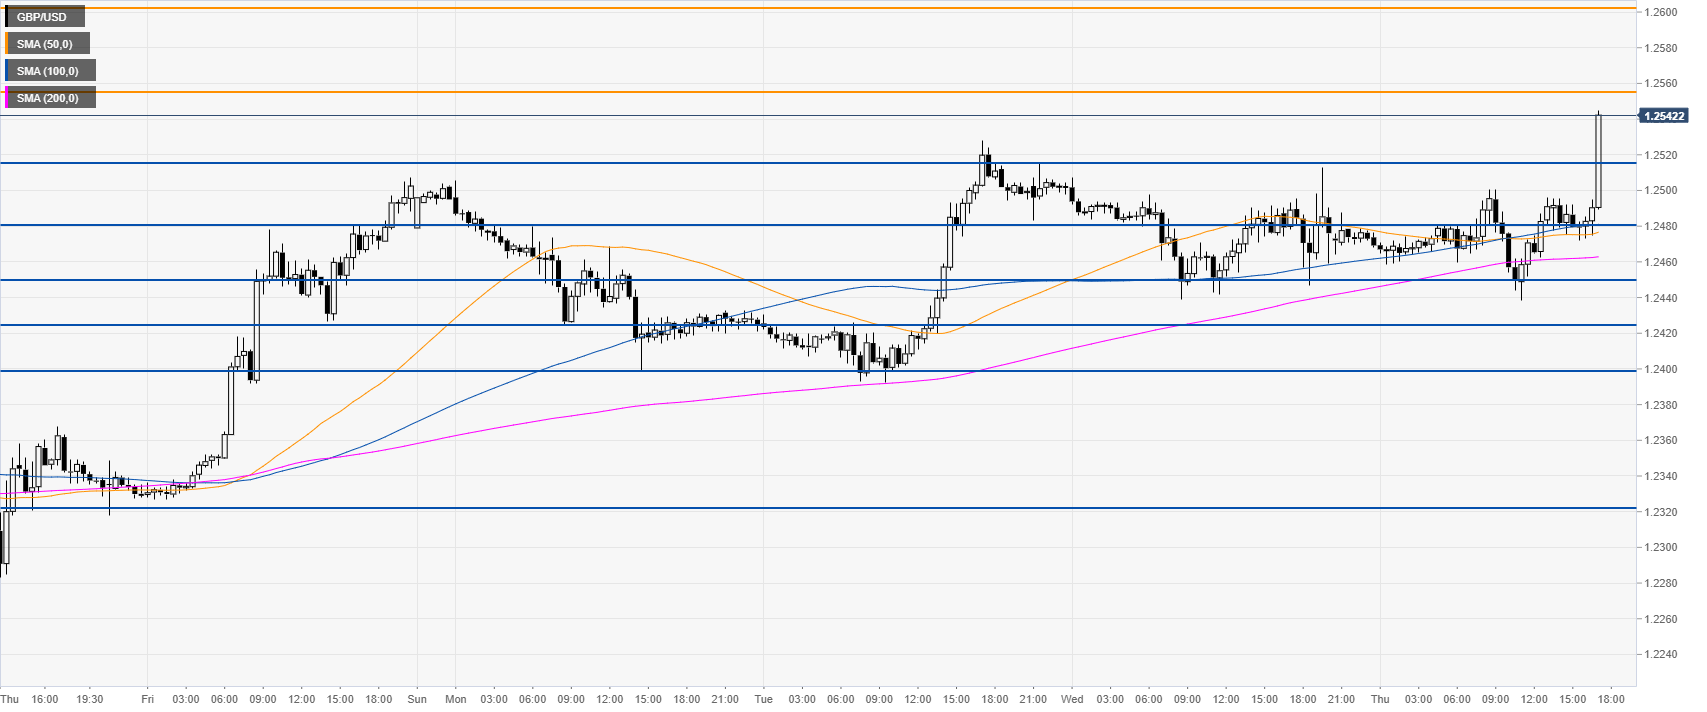
GBP/USD 30-minute chart
A daily close above the 1.2515 level will further embolden the bull case. Further down li 1.2480 and 1.2450 support, according to the Technical Confluences Indicator.
Additional key levels
