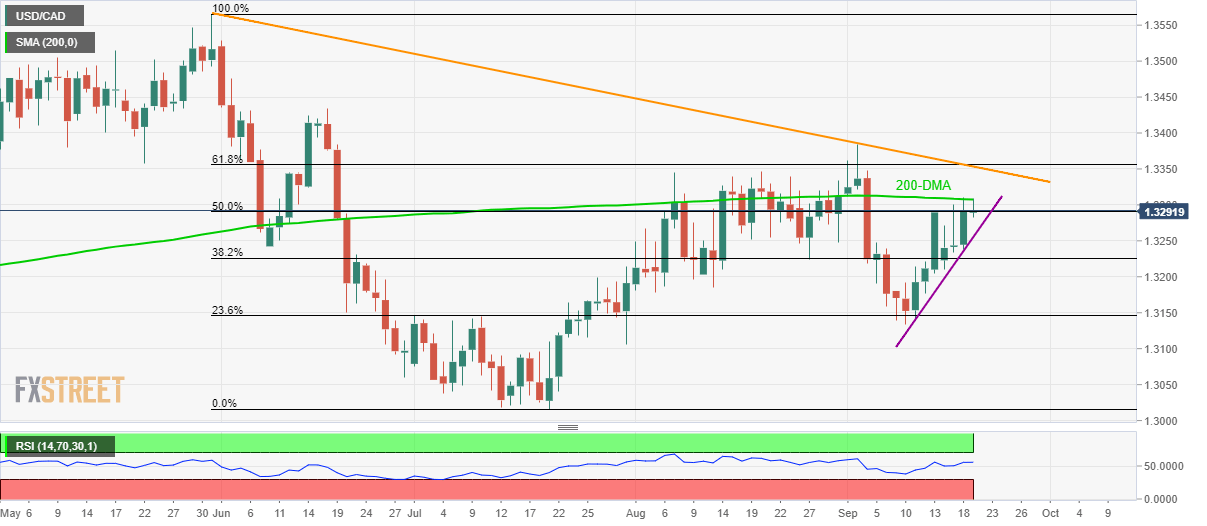
- USD/CAD struggles around 50% Fibonacci retracement of May-July downpour.
- Upbeat RSI, one-week-old rising trend-line favors break of 200-DMA.
- 61.8% Fibonacci retracement, 3.5-month-long resistance-line becomes the key.
Not only one-week-old rising trend-line but upbeat relative strength index (RSI) also favors the USD/CAD pair’s upside as it takes the bids to 1.3290 amid initial trading session on Thursday.
The 200-day simple moving average (DMA) near 1.3310 becomes immediate resistance to watch during the pair’s further upside, a break of which could escalate the run-up towards 1.3350/55 resistance-confluence including 61.8% Fibonacci retracement and a downward sloping trend-line since May-end.
Should there be further upside beyond 1.3355, monthly top surrounding 1.3385 and June 18 high near 1.3435 could flash on buyers’ radar.
Meanwhile, a downside break below 1.3255 support-line can recall 38.2% Fibonacci retracement level of 1.3226 whereas monthly low near 1.3134 will challenge sellers afterward.
USD/CAD daily chart
Trend: bullish
