EUR/USD has been remarkably stable amid the Federal Reserve’s rate cut and drama in oil markets. How is it positioned as the week draws to a close?
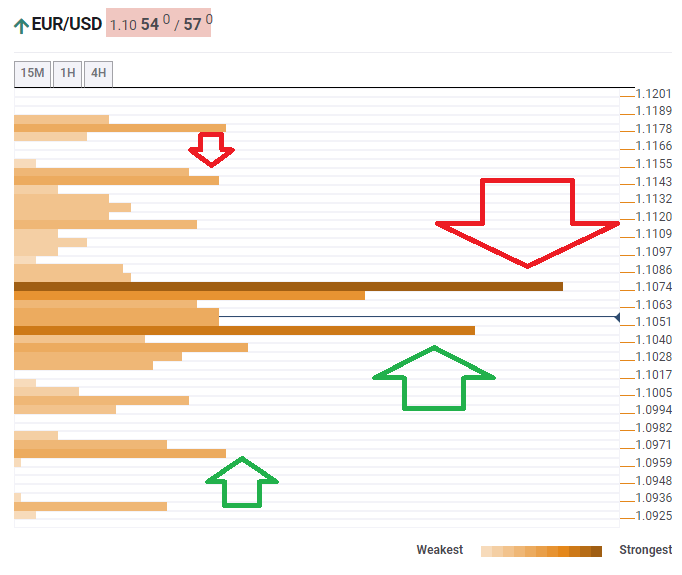
The Technical Confluences Indicator is showing that EUR/USD has support at 1.1045, which is the convergence of the Fibonacci 38.2% one-week, the Fibonacci 61.8% one-day, the Simple Moving Average 100-1h, the SMA 200-1h, the Bollinger Band 4h-Middle, and the BB one-day Middle.
If it falls below this level, the world’s most popular currency pair has only weak support. The next noteworthy level is 1.0965, which is the confluence of the BB 1d-Lower, the Pivot Point one-week Support 1, and the PP 1d-S3.
Looking up, fierce resistance awaits at 1.1074. The dense cluster includes the BB 1h-Upper, the PP 1d-R1, the Fibonacci 38.2% one-month, the previous daily high, and the Fibonacci 23.6% one-week.
Also here, if EUR/USD breaks free to the upside, it has room to run. However, the resistance line is stronger than support.
An upside move could target 1.1143, which is the meeting point of the Fibonacci 61.8% one-month and the PP 1w-R1.
Here is how it looks on the tool:
Confluence Detector
The Confluence Detector finds exciting opportunities using Technical Confluences. The TC is a tool to locate and point out those price levels where there is a congestion of indicators, moving averages, Fibonacci levels, Pivot Points, etc. Knowing where these congestion points are located is very useful for the trader, and can be used as a basis for different strategies.
This tool assigns a certain amount of “weight” to each indicator, and this “weight” can influence adjacents price levels. These weightings mean that one price level without any indicator or moving average but under the influence of two “strongly weighted” levels accumulate more resistance than their neighbors. In these cases, the tool signals resistance in apparently empty areas.
Learn more about Technical Confluence
