- The Greenback rose this Friday but remains trapped within its weekly range.
- The level to beat for bulls is the 98.55/98.68 resistance zone.
- DXY ends the week about 45 cents higher.
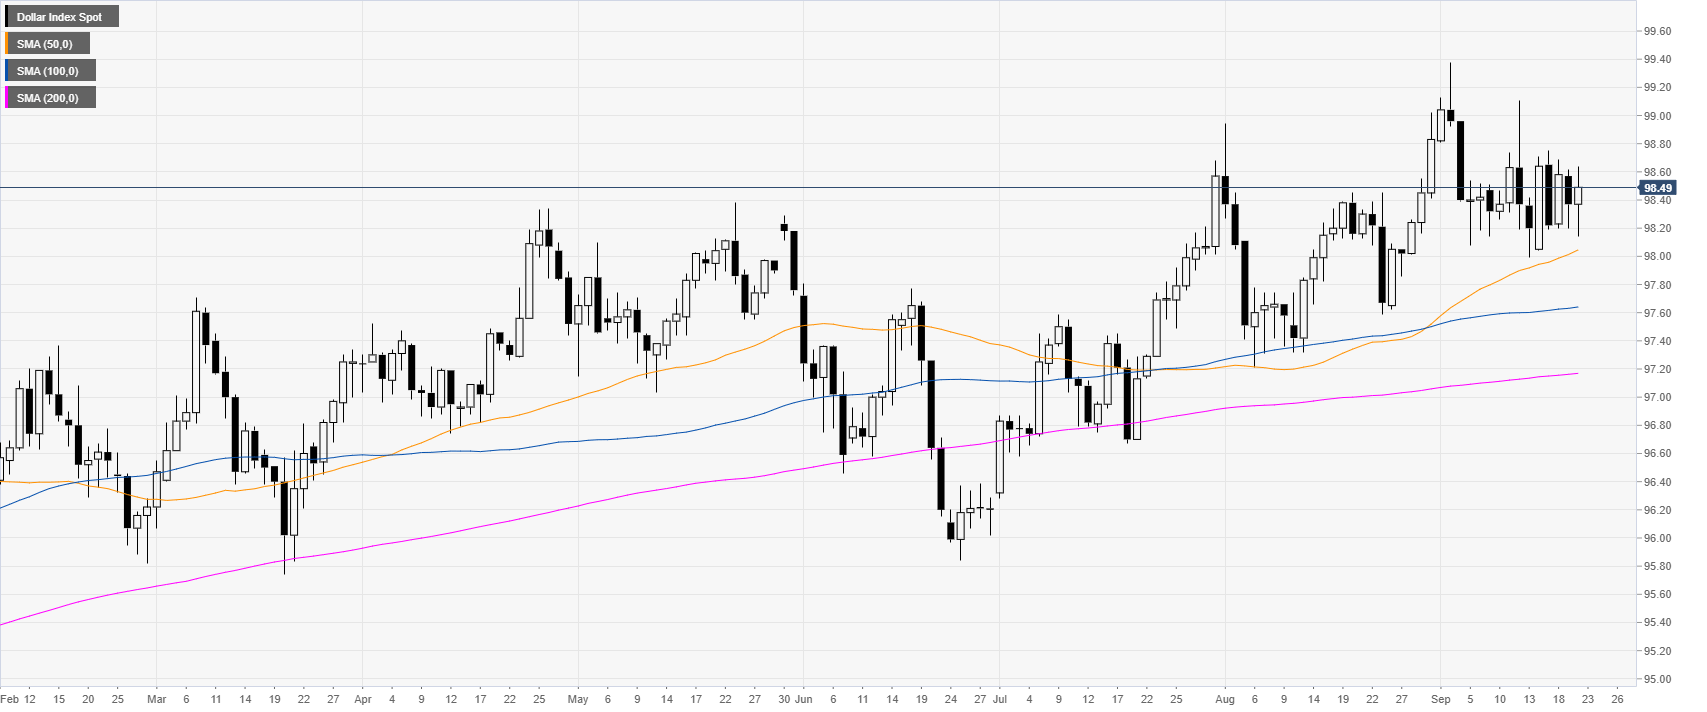
DXY daily chart
DXY (US Dollar Index) is trading in a bull trend above its main daily simple moving averages (DSMAs). In the last two weeks, the Greenback has been in a trading range around the 98.40 level as investors are waiting for a catalyst.
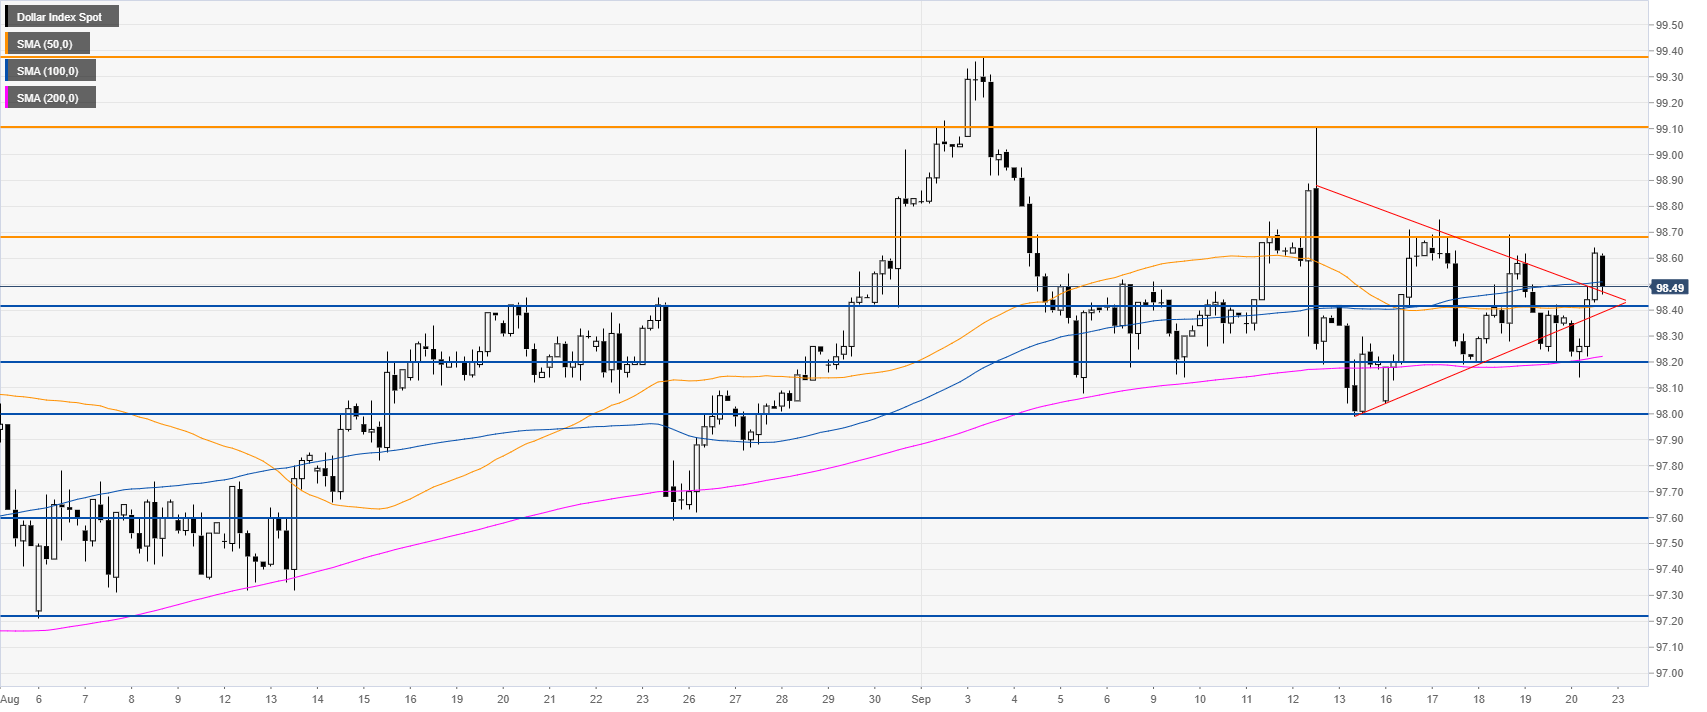
DXY four-hour chart
DXY is trading above the 50/200 SMAs, suggesting bullish momentum. The Greenback gained some relative strength this Friday as it broke above the triangle pattern. The market is retracing down and buyers will need to defend the 98.42 and 98.20 support if they intend to lift the market towards 99.10 and 99.38 resistances. The market would need a daily close beyond 98.68 to pull away from the trading range.
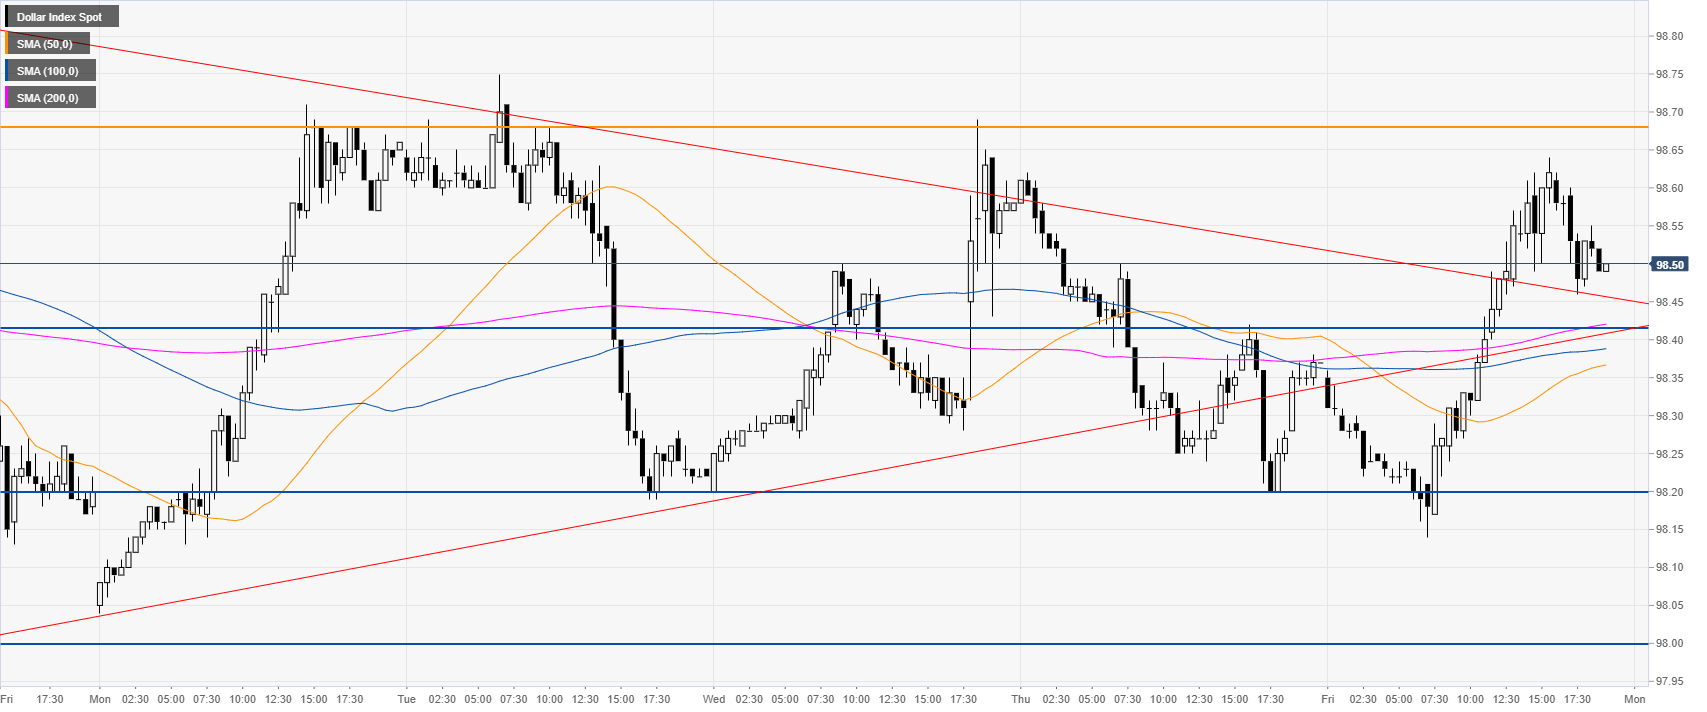
DXY 30-minute chart
DXY is trading above the main SMAs, suggesting bullish momentum in the near term. Support is seen at the 98.42 and 98.20 price levels. A break below 98.20 would be seen as bearish.
Additional key levels
